PostgreSQL Fundamentals
This is a premium course
And it's amazing and you'll love it, I promise (and guarantee it).

Why SQL? How Mastering Databases Can Boost Your Career and Problem-Solving Skills
You're about to dive into the glorious world of databases and the language of data - SQL. Lucky you! Our working data set will be the actual data from the Cassini mission, specifically that of Enceladus, an icy moon orbiting Saturn that is confounding scientists.

Postgres Setup: How to Quickly Install Your SQL Environment
We'll be using PostgreSQL for our SQL and analysis tasks. You can use other systems and they work just fine - but for this one we'll be using PostgreSQL. We have a bunch of data to load up and poke through, so let's get rolling quickly OK?
Your Environment is Critical: Using the Power of Shell Scripts to Shape Our Process
When working with data you often hear the terms 'extraction, transformation and loading' or ETL. This is something that data analysis people think about more than say Application Developers - which I think is a bummer. It's important to know how the data in any application is going to be used so you can make sure you collect the right stuff!
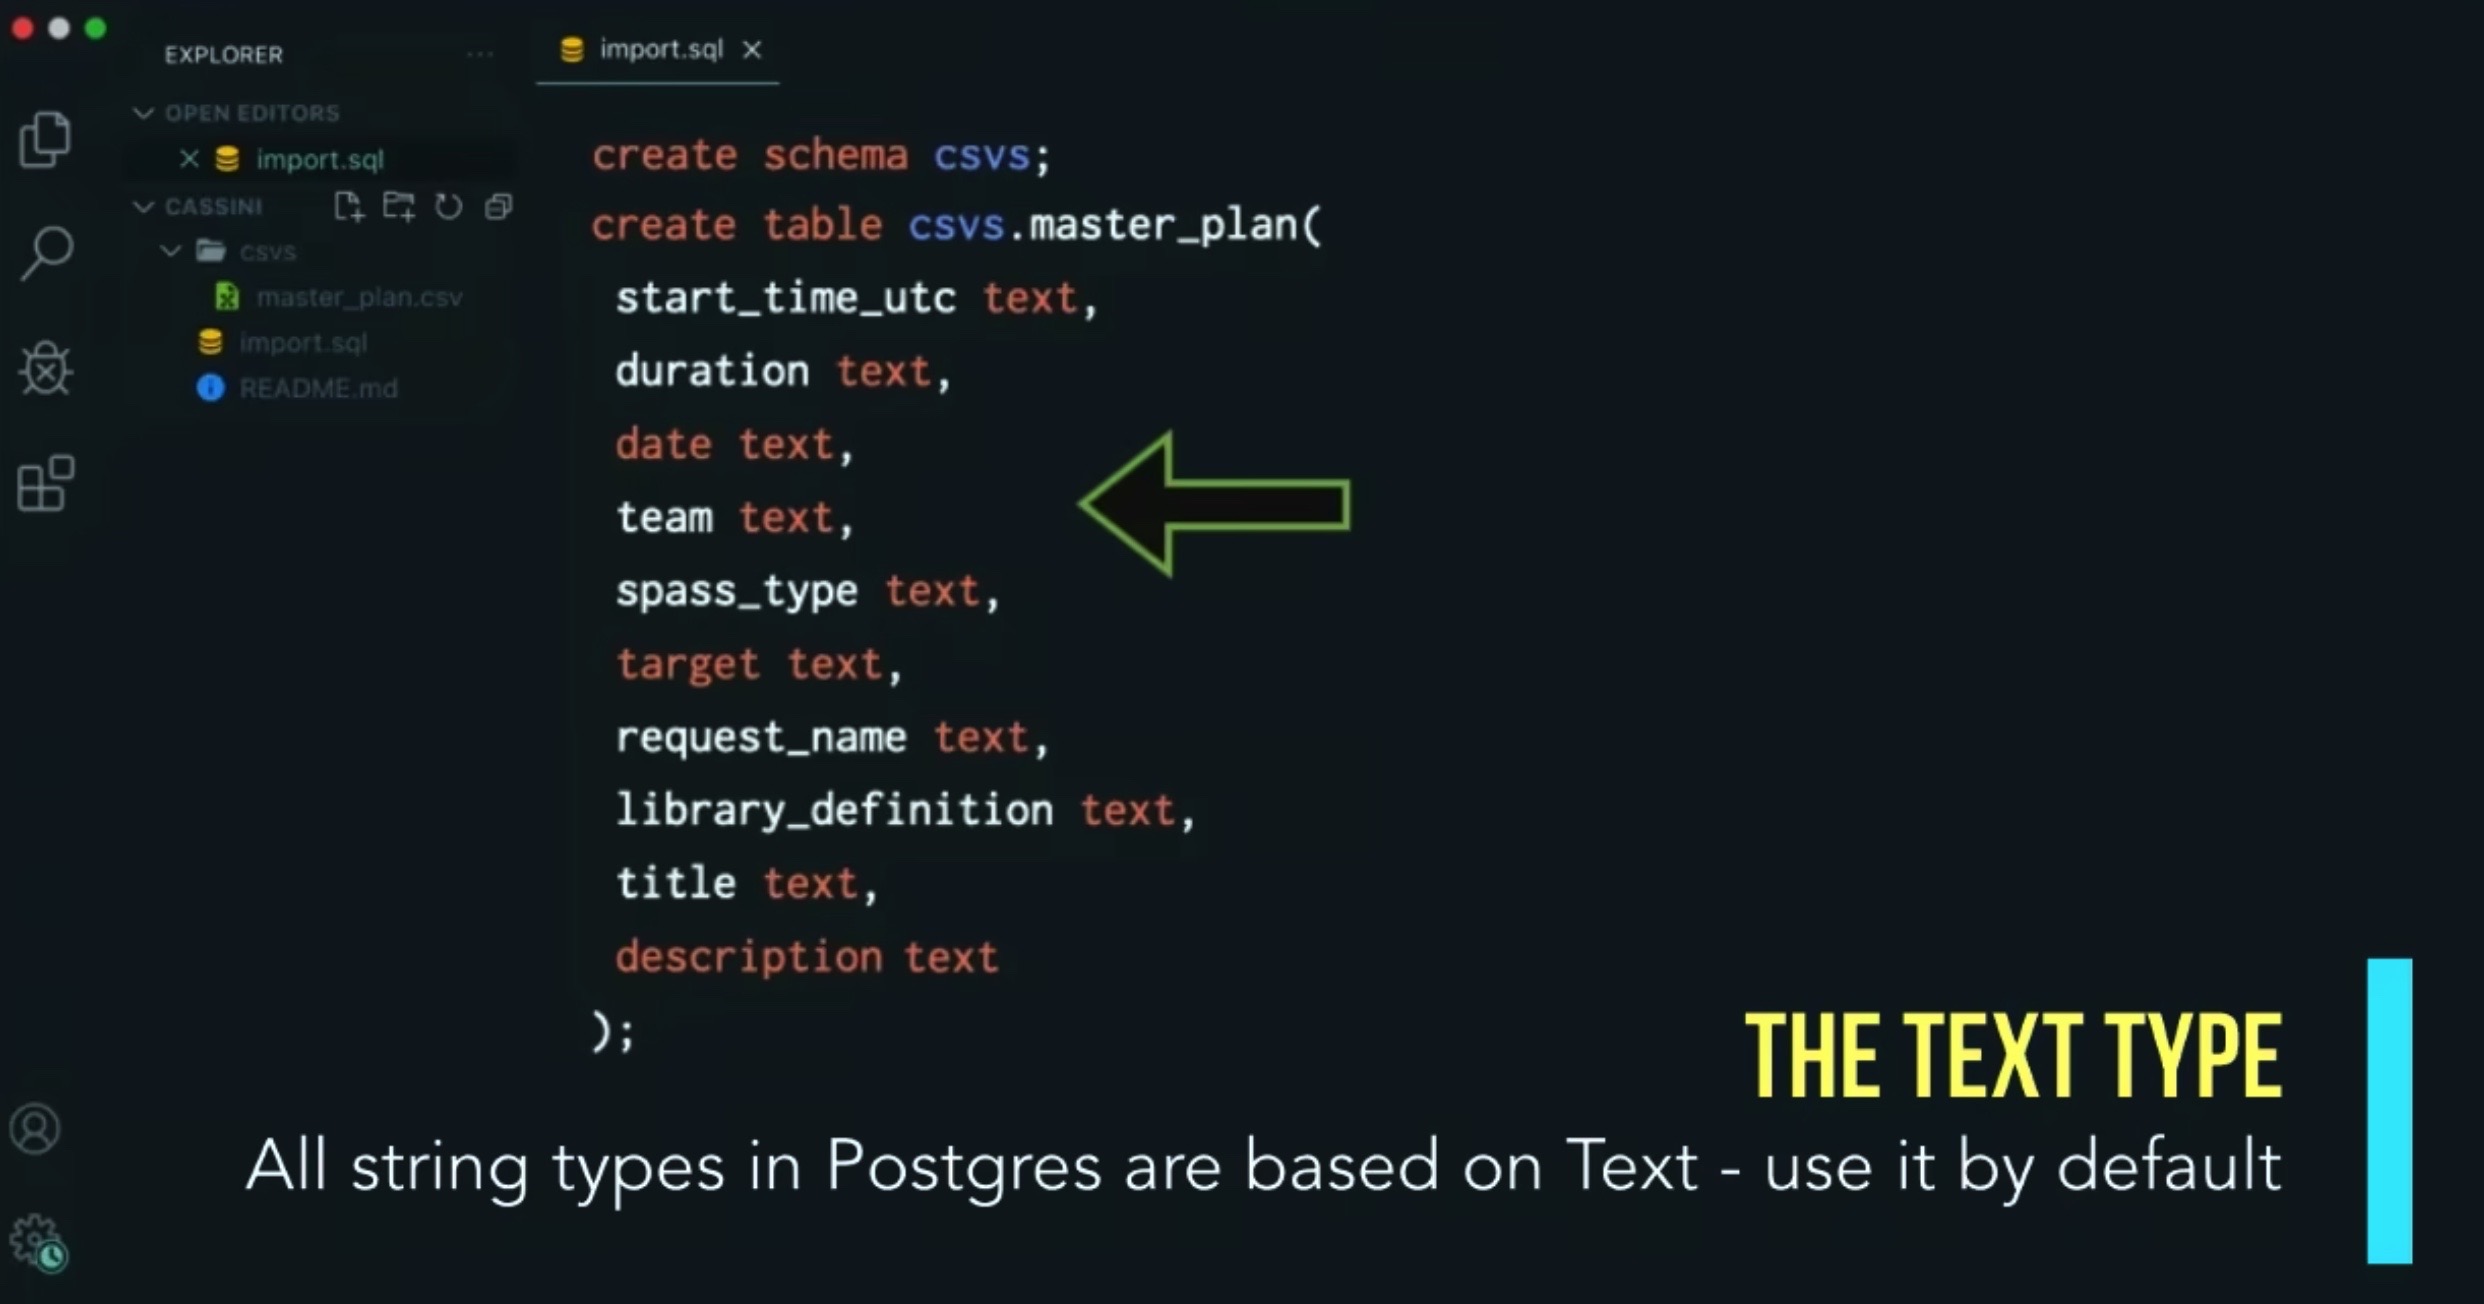
How to Load Raw Data Without Breaking Anything
Our first task is to find the exact dates and times when Cassini flew by Enceladus and made its measurements. We need to create a time window so we can narrow down the results from the INMS - Cassini's on board Ion Neutral Mass Spectrometer - that's the thing that sniffed space for the chemicals we're looking for. Off we go!
How to Quickly Peek Inside Your Database Like a Pro Using psql
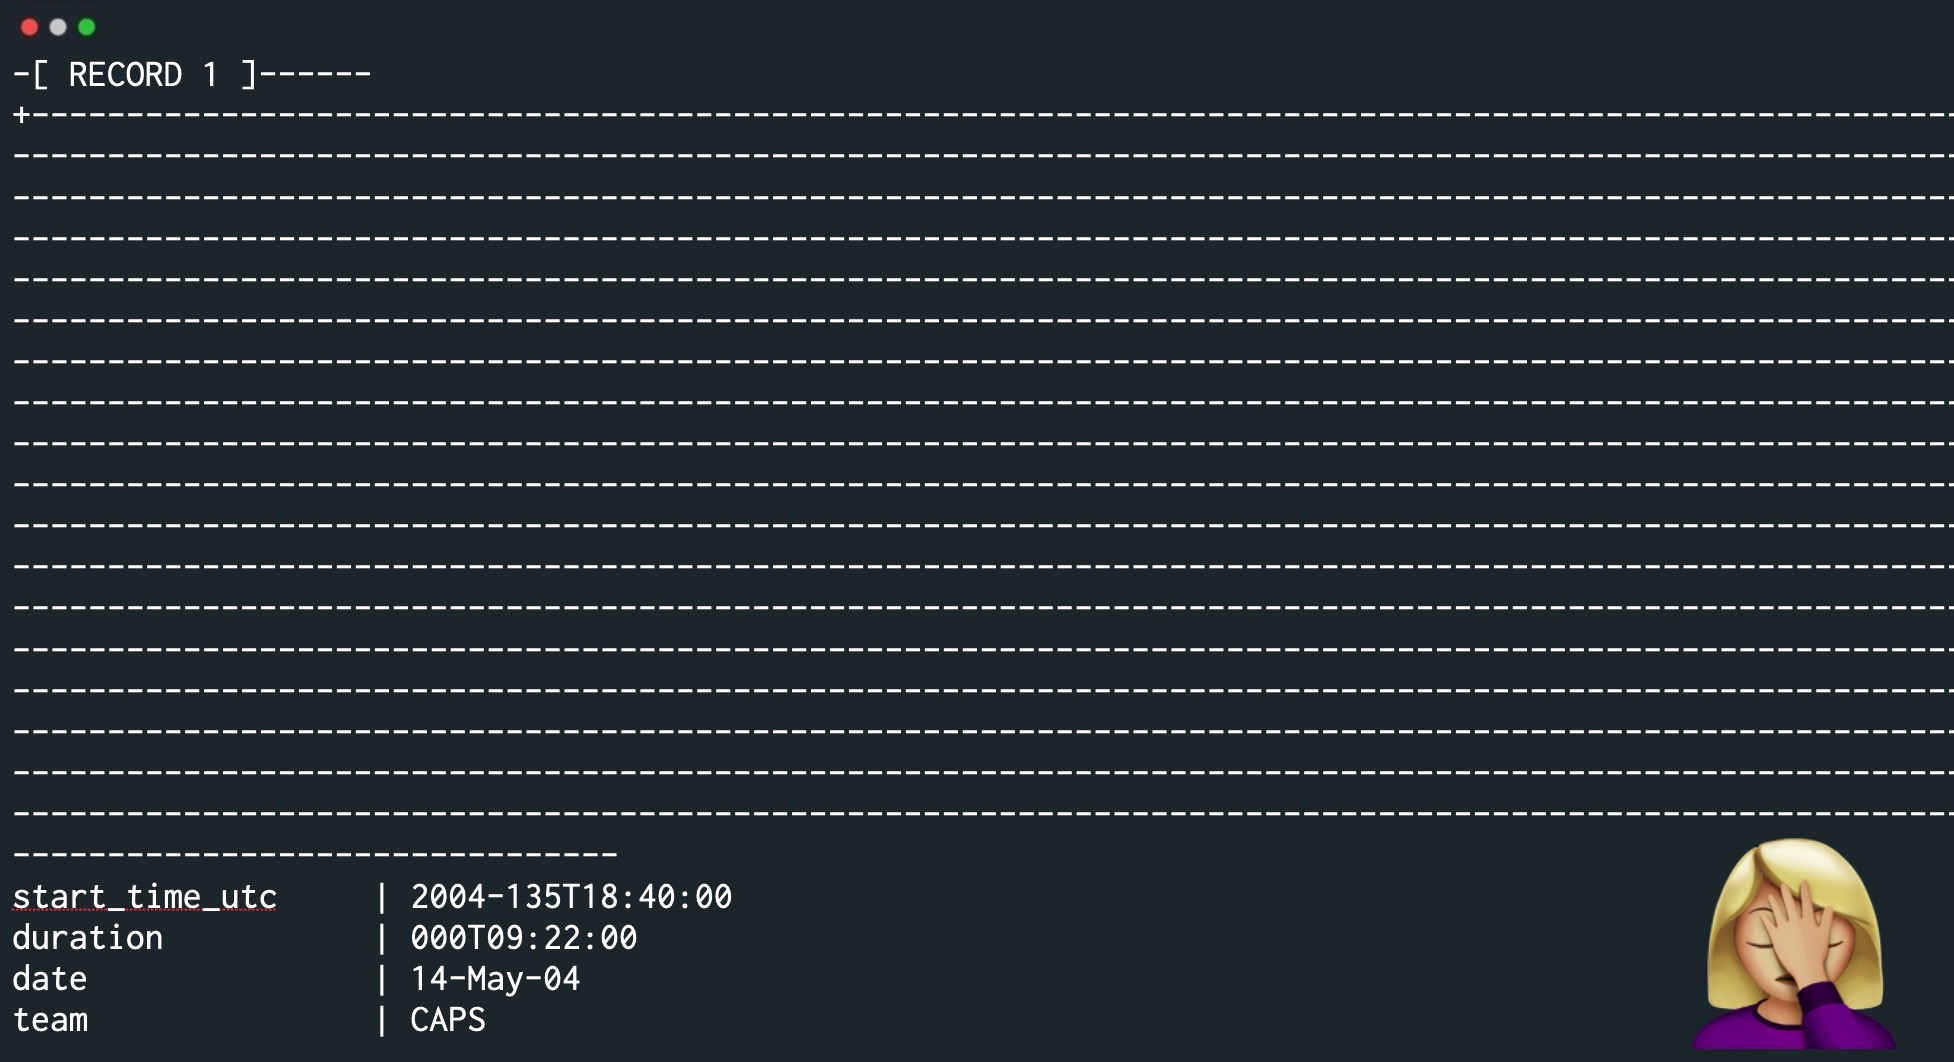
Now that the data is in the database, let's poke around and see what we have, using simple select statements and getting to know the Postgres client tool psql.
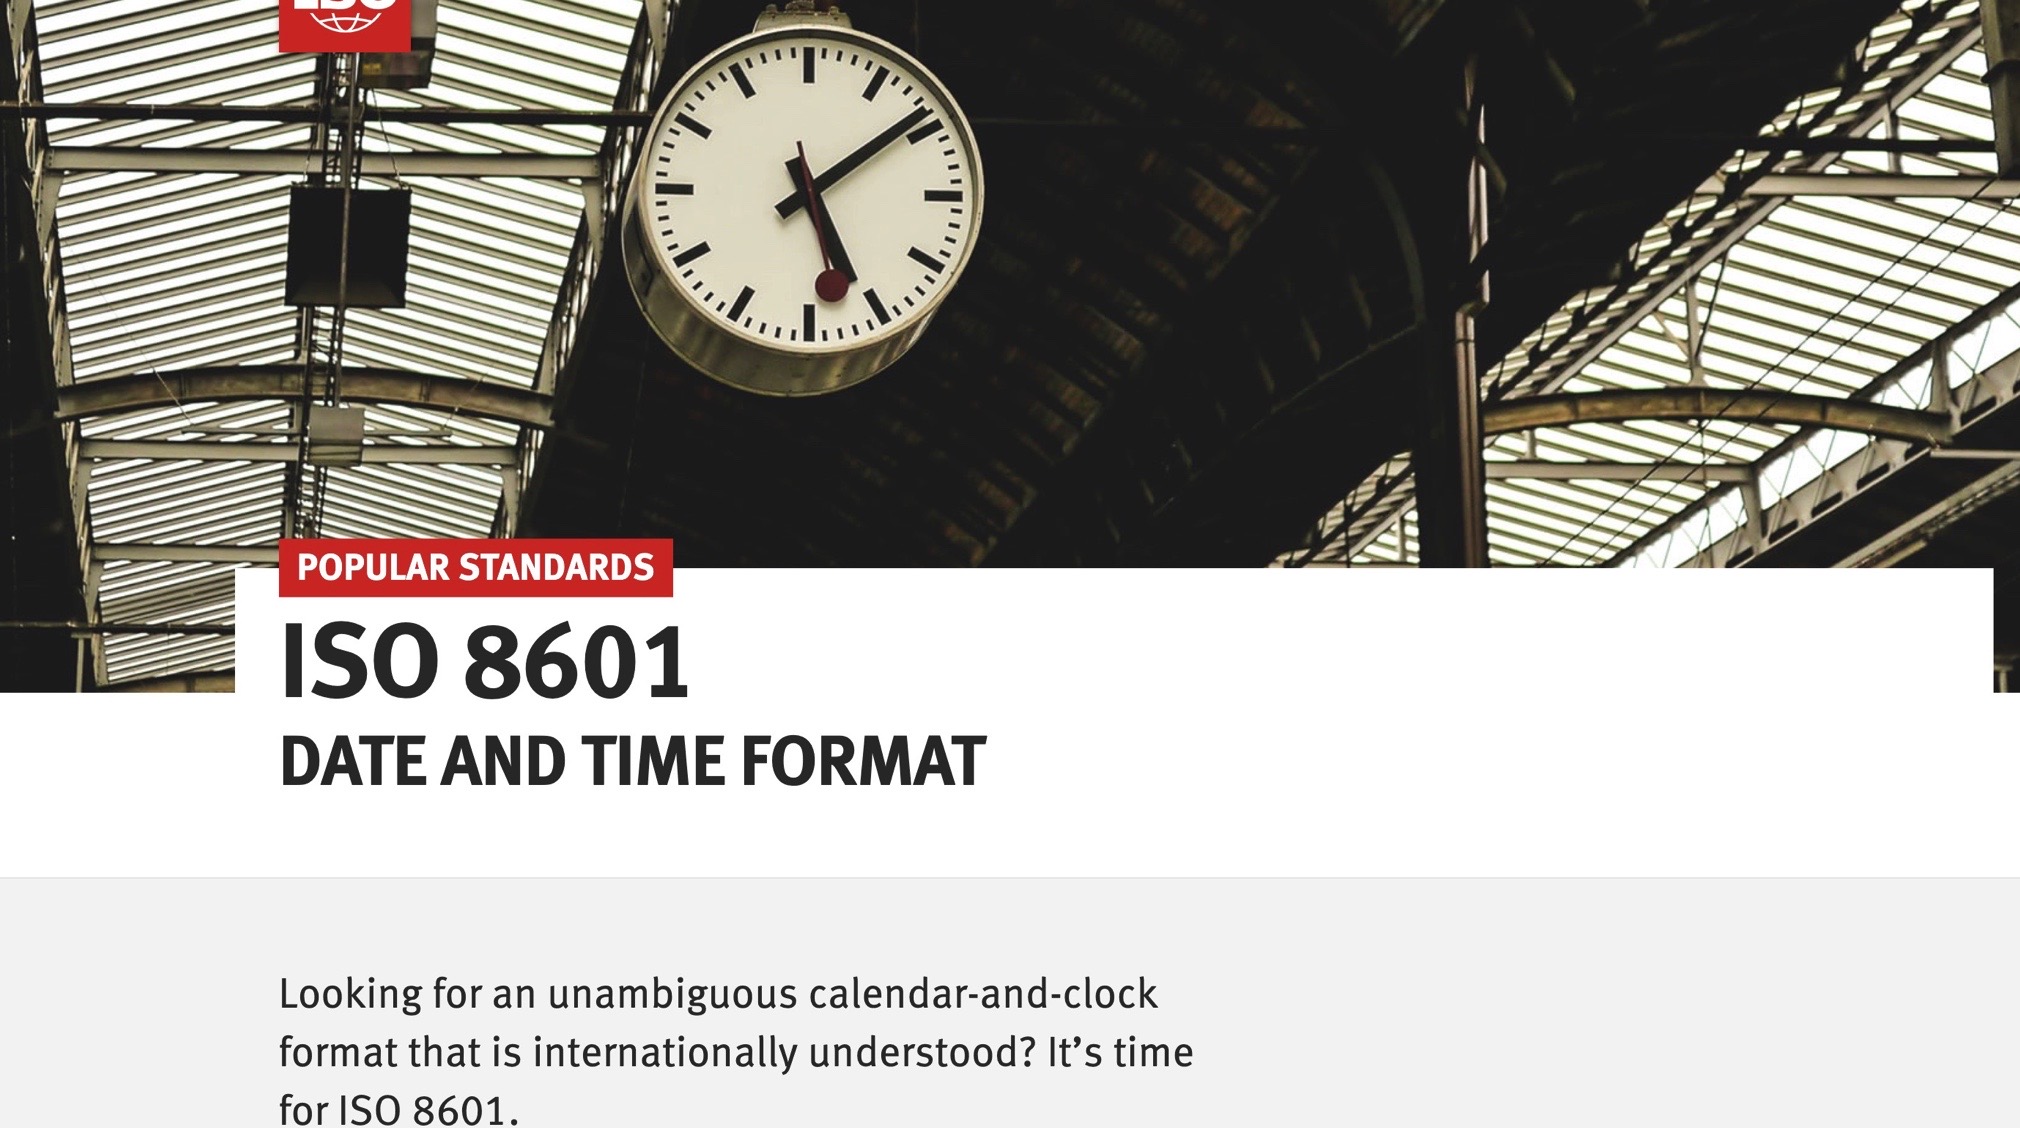
Making Dates and Times Less Meaningless in Postgres
Dates and timestamps are core to working with data as you will often find that if you don't know precisely WHEN something happened, it will become meaningless. Dates mark changes over time - those changes will often drive business decisions, so you better be correct!
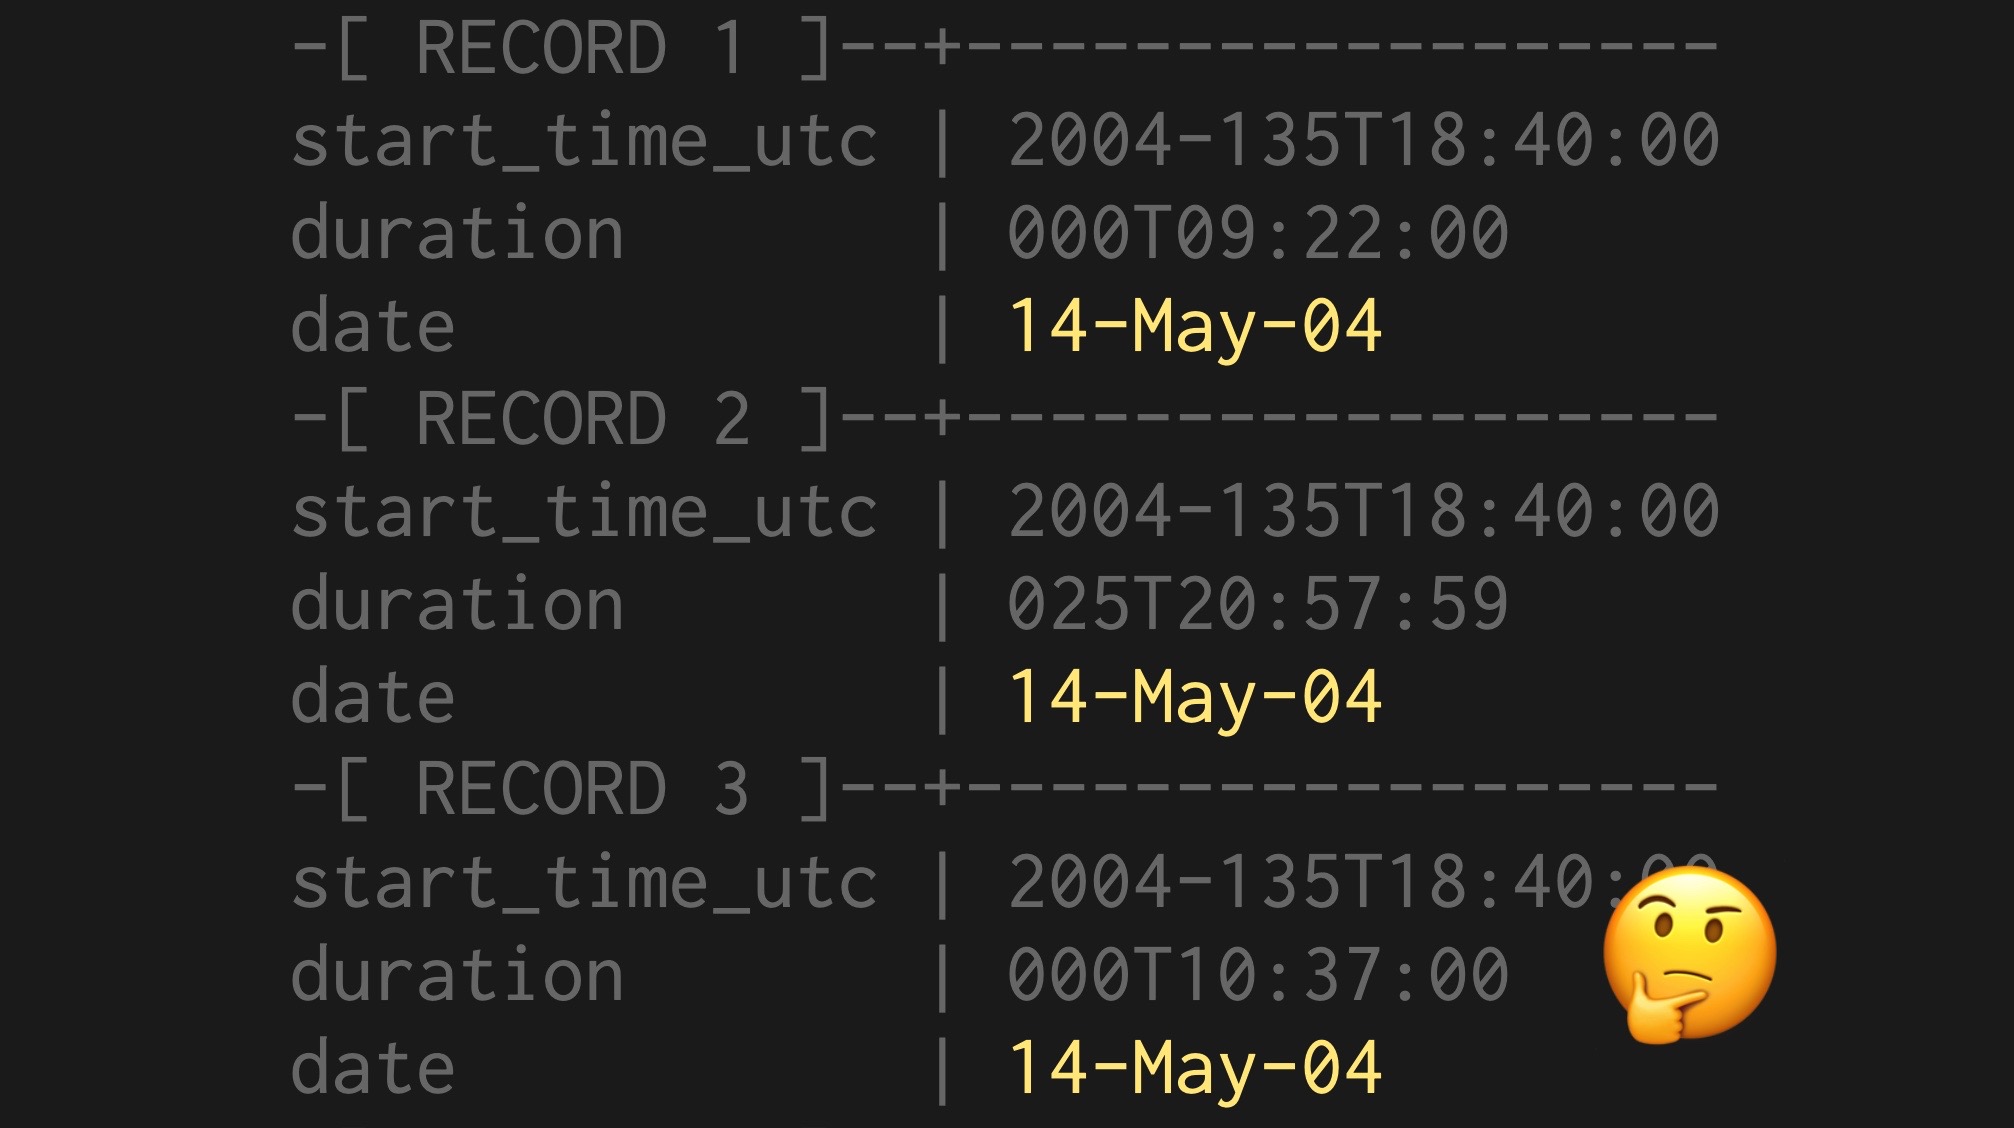
Validating Dates So You Don't Get Fired
The data in our mission plan looks straightforward but since it's a plan that is based on dates, we need to jump right into validating those dates. Thankfully for us, Postgres is outstanding at date and time functionality!
Fail-Proof Imports: The Simple Trick to Error-Free Database Scripts
We don't like errors when running our imports and, unfortunately since we're human, we're going to have a lot of them. Instead of fixing things piecemeal, it's always better to just rerun everything.
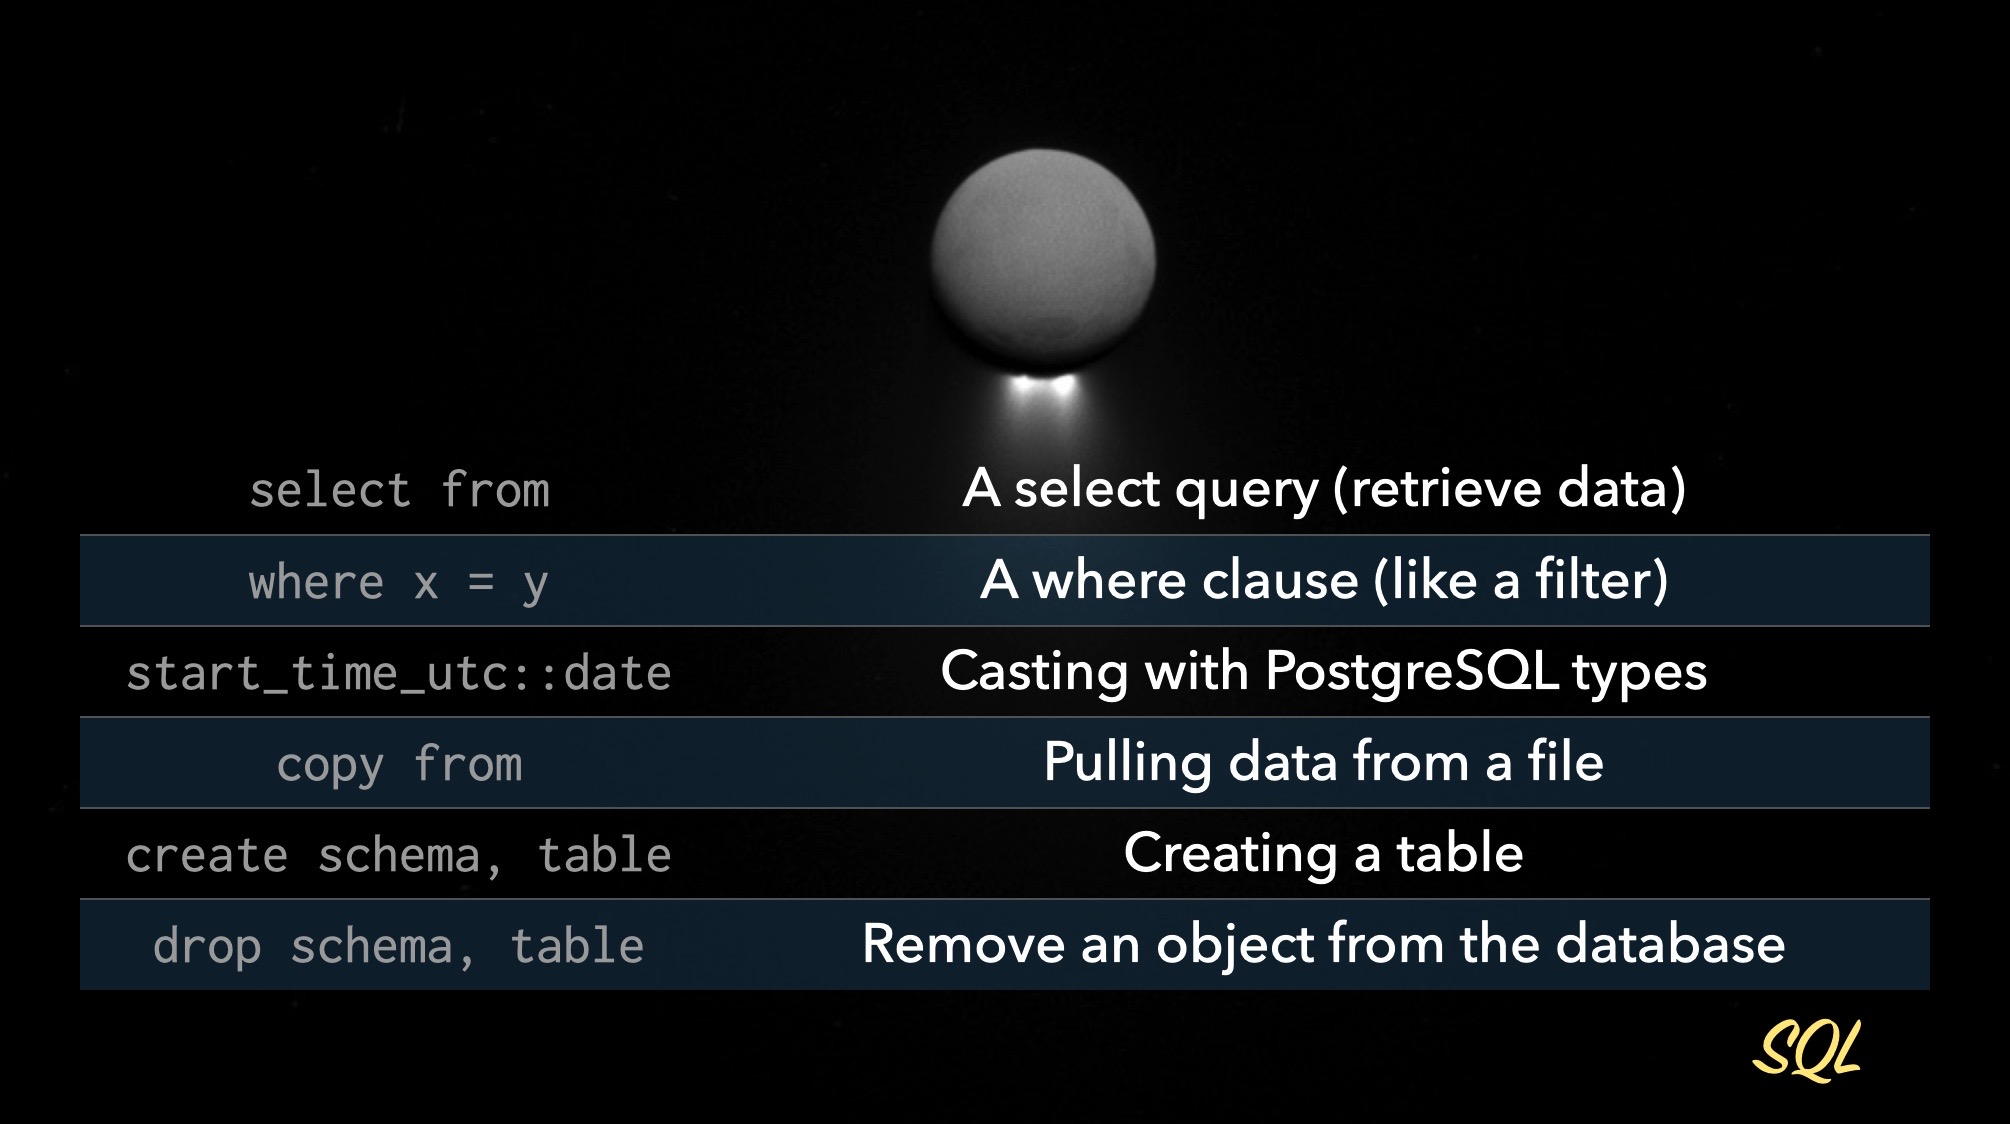
Never Trust a Spreadsheet: How to Safely Extract Data with SQL
We did a lot in this section! We dipped our toes into the lovely world of SQL and we also learned that we should NEVER trust a spreadsheet!
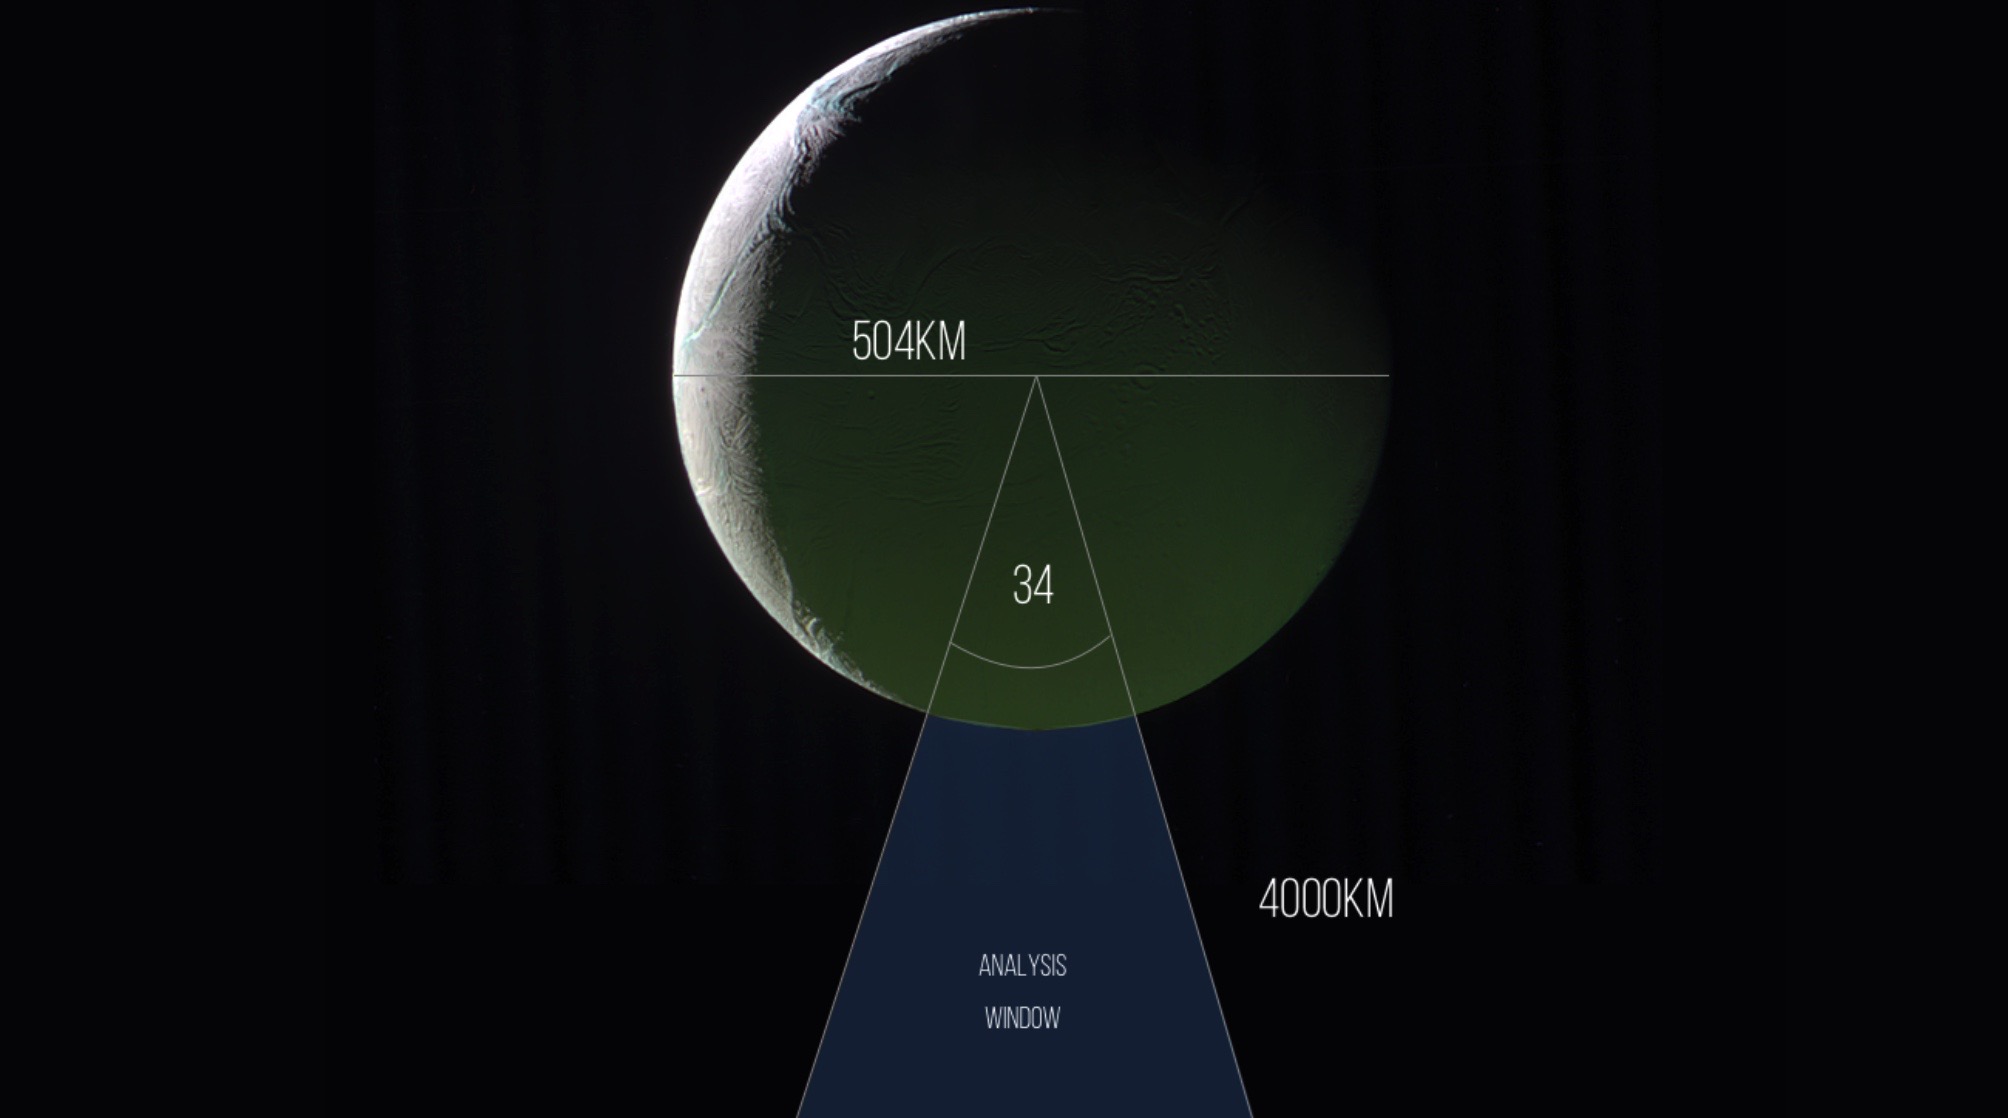
The Data Comes to Life: Extracting Cassini's Flybys of Enceladuse
We have our tools and our initial extraction ready to go, now let's get to work finding the flybys of Enceladus! In this section we'll focus on transforming this data into something we can query with some degree of confidence and then, hopefully, we'll find the exact time windows for the flybys.
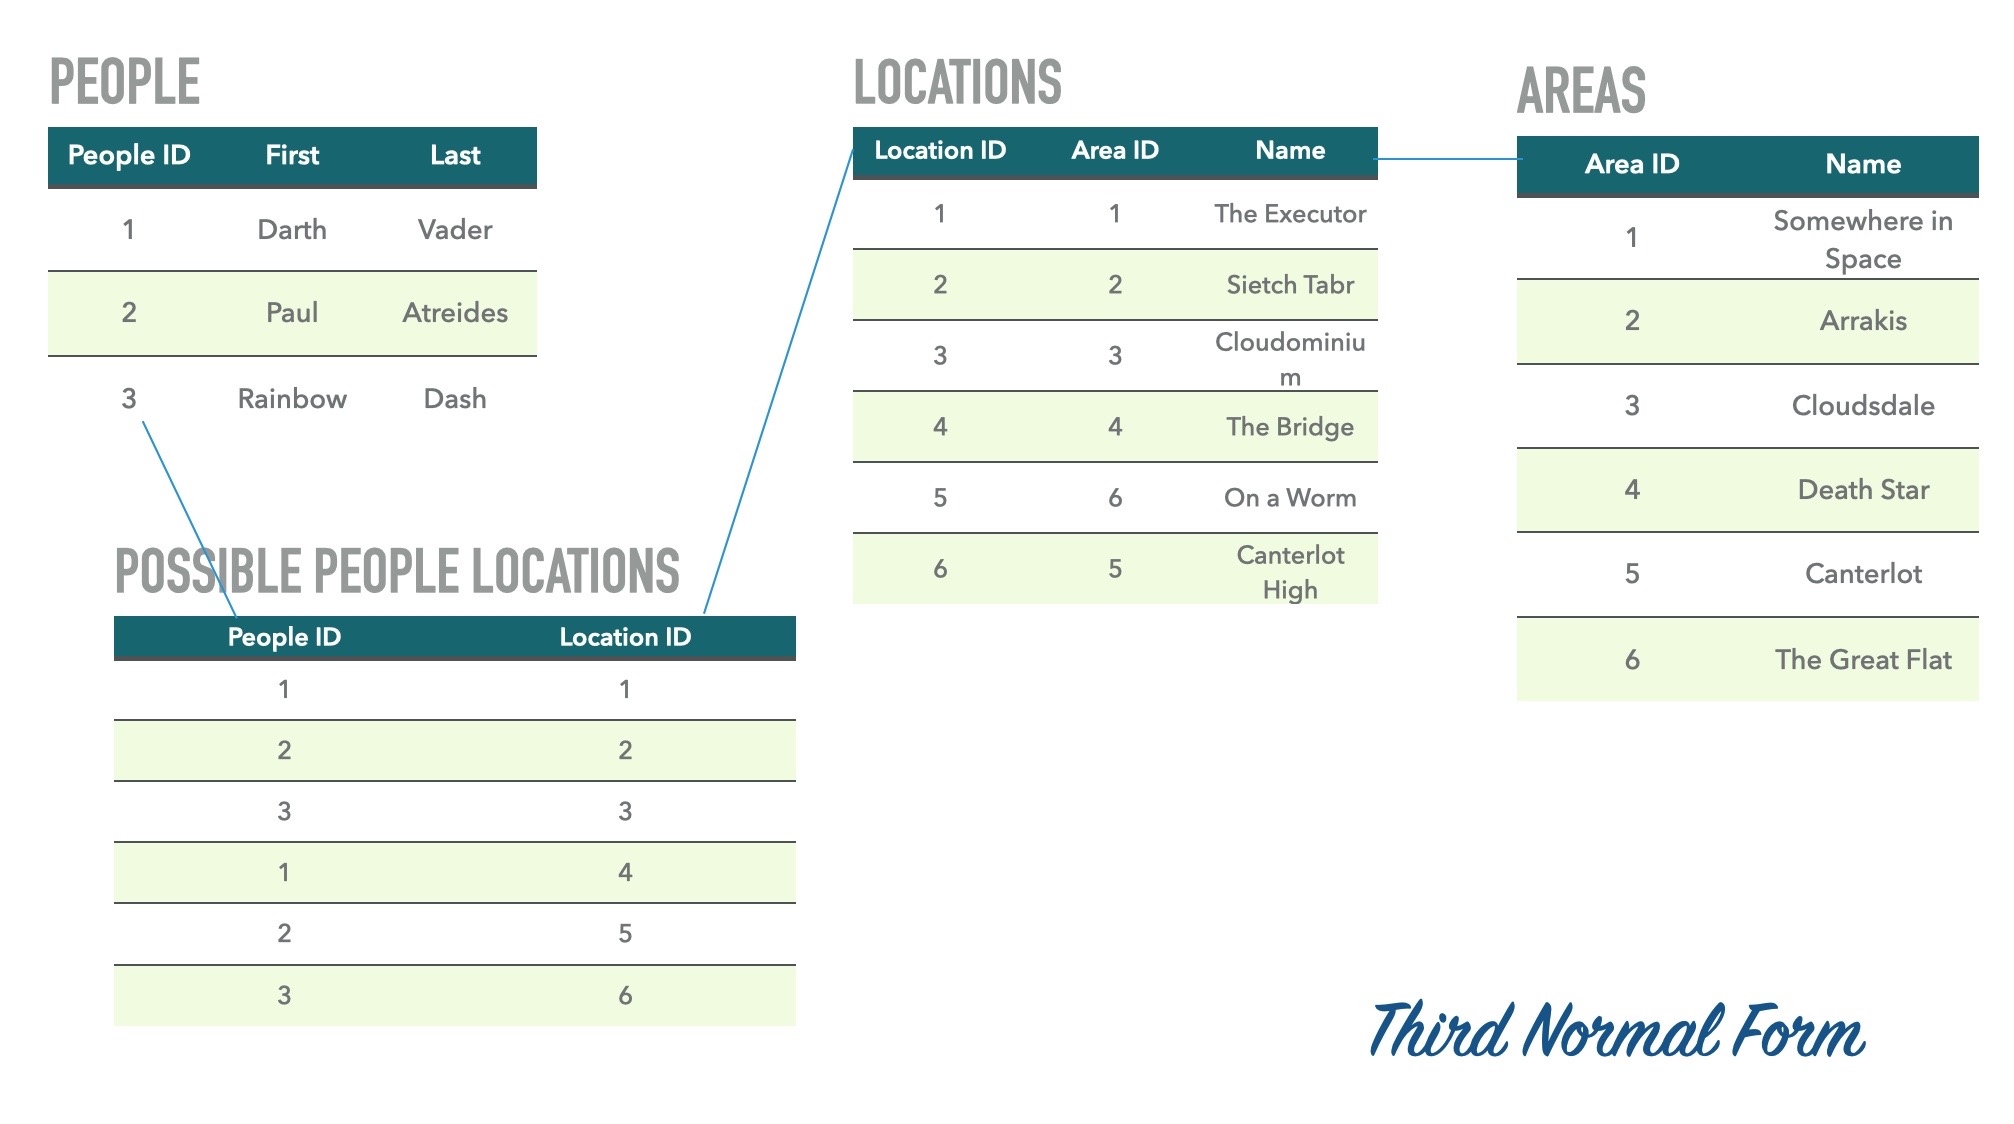
Normalization Explained: How to Structure Your Data for Maximum Clarity
Structuring a relational database is (typically) all about following the rules of normalization, called 'normal forms'. Sounds theoretical, but it's pretty straightforward.
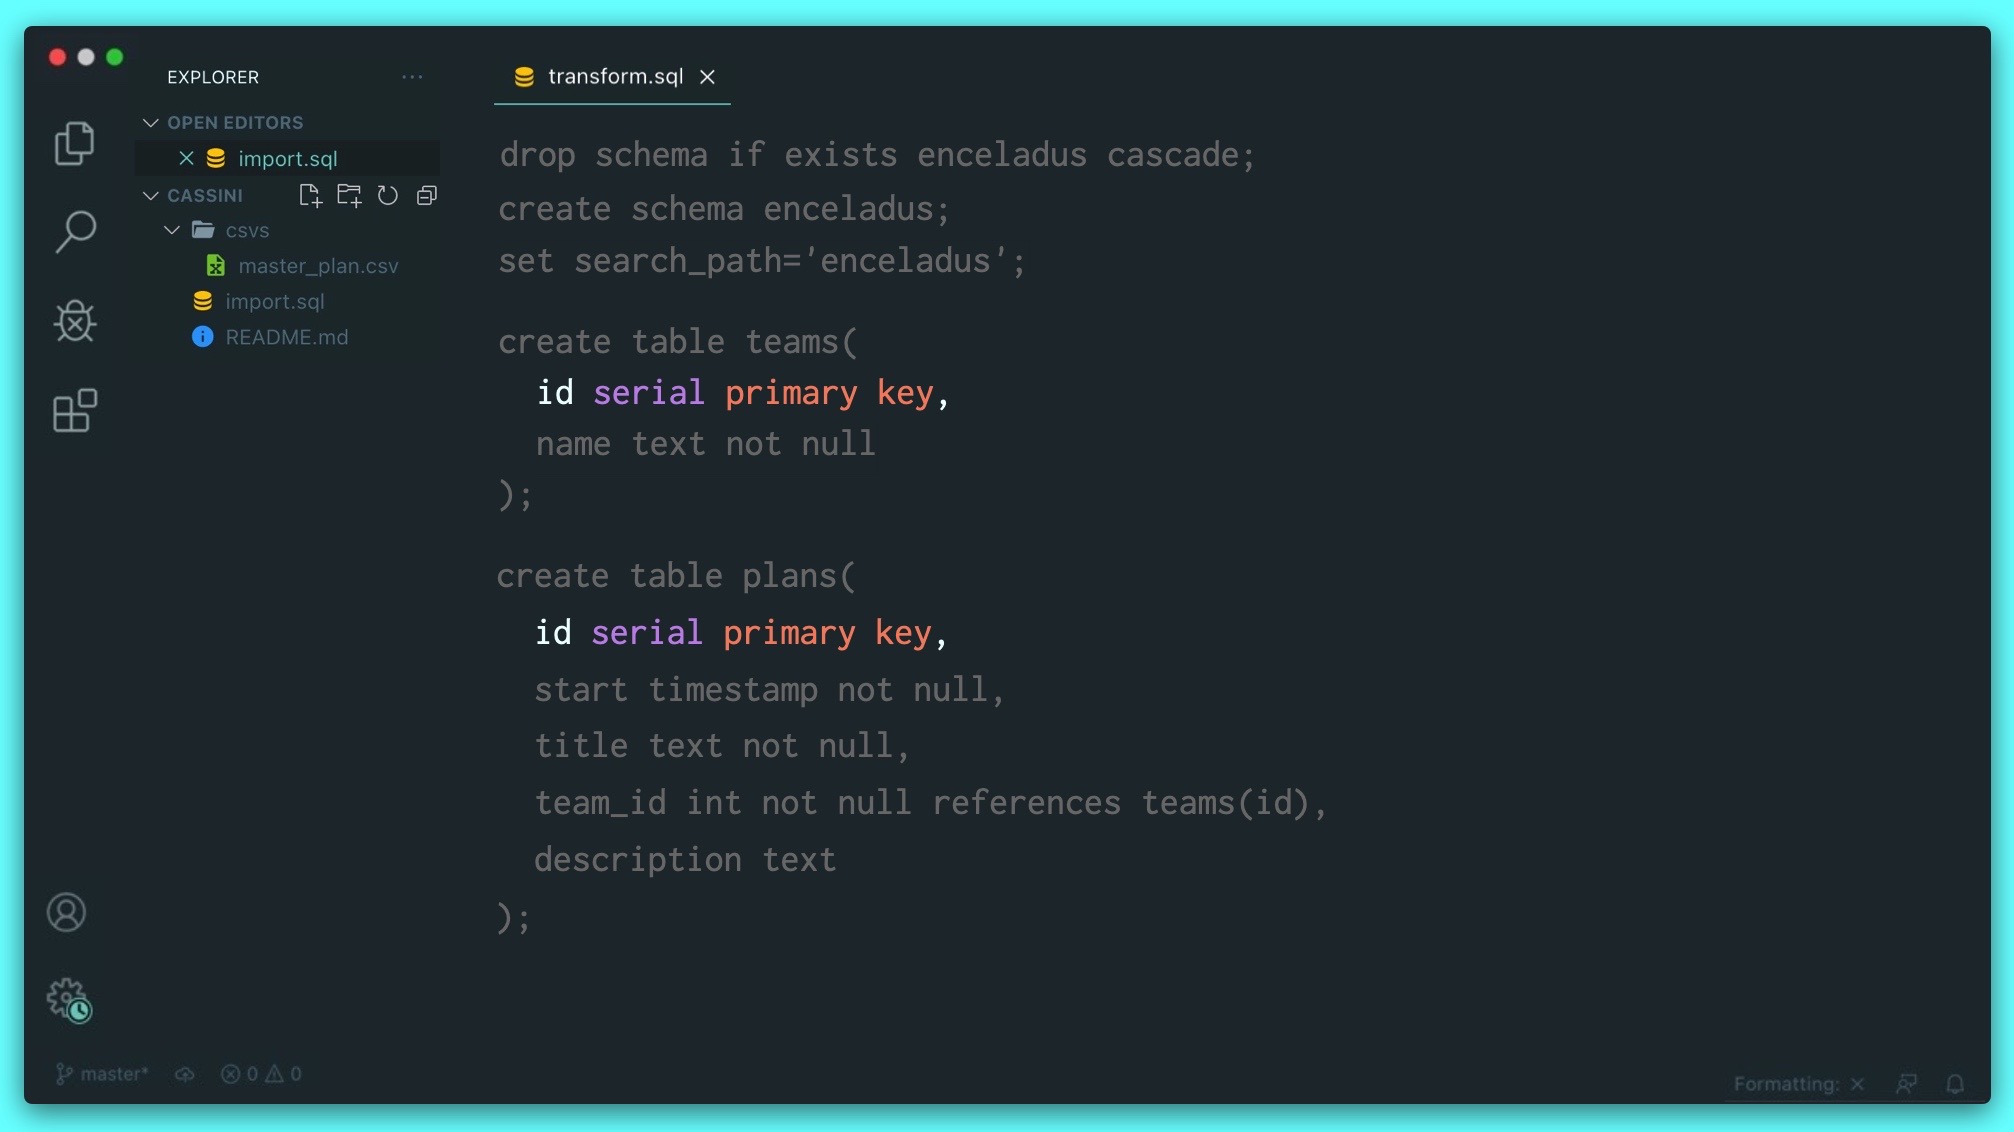
That's Not Normal(ized): Know Your Data Before You Build Your Tables
Before we can normalize the mission plan data, we need to understand what's in the table and how it's related.
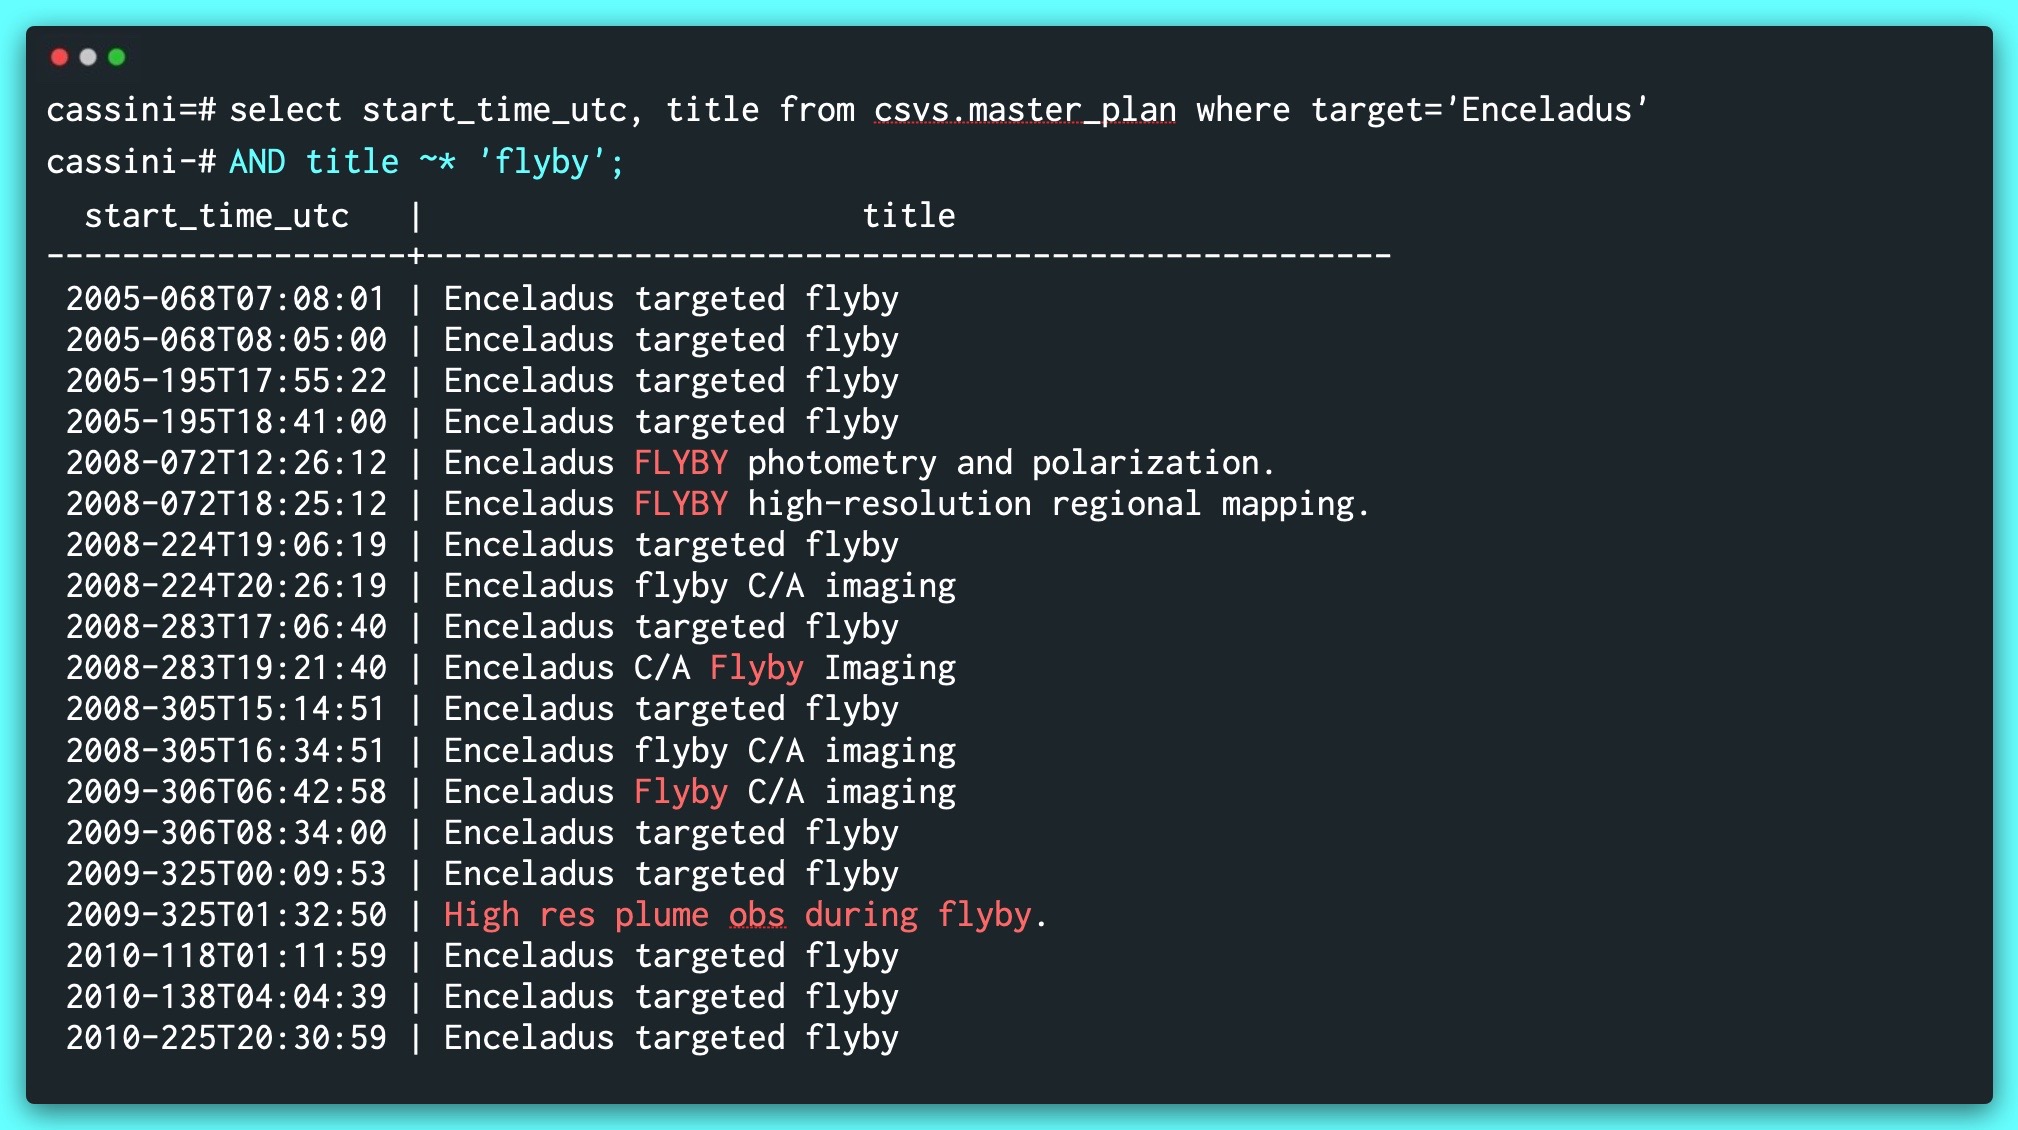
Just the Facts: Extracting Only What You Need To Avoid Unecessary Work
Our inspection showed us how we can isolate the Enceladus data - now let's do it!
Going Deeper: Getting Around Our First Obstacle With the Power of SQL
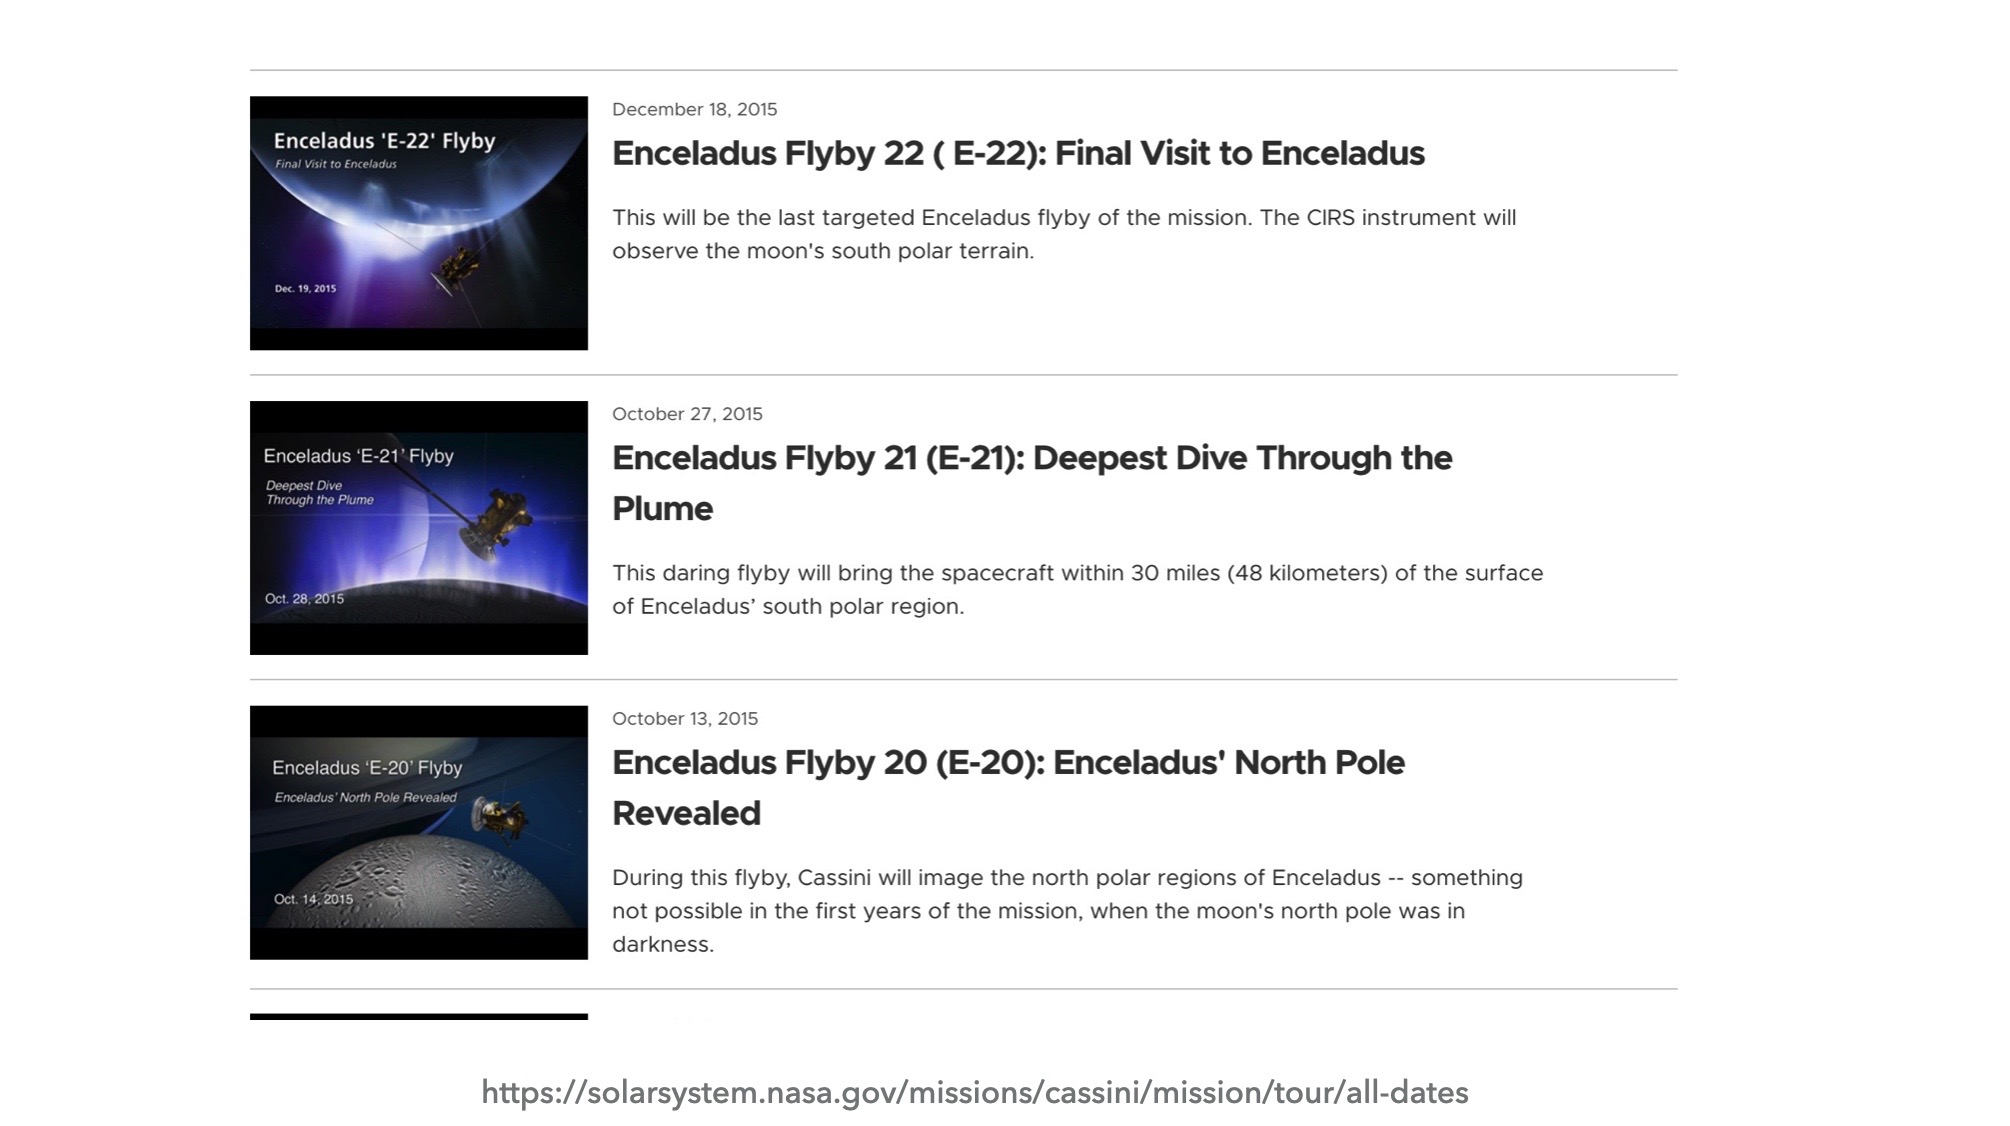
It's time to nail down the flybys! We have a plan table full of Enceladus mission plan goodness - now we just need to figure out how to sift the data correctly.
How Losing Hours of Work Can Actually Be Good For You
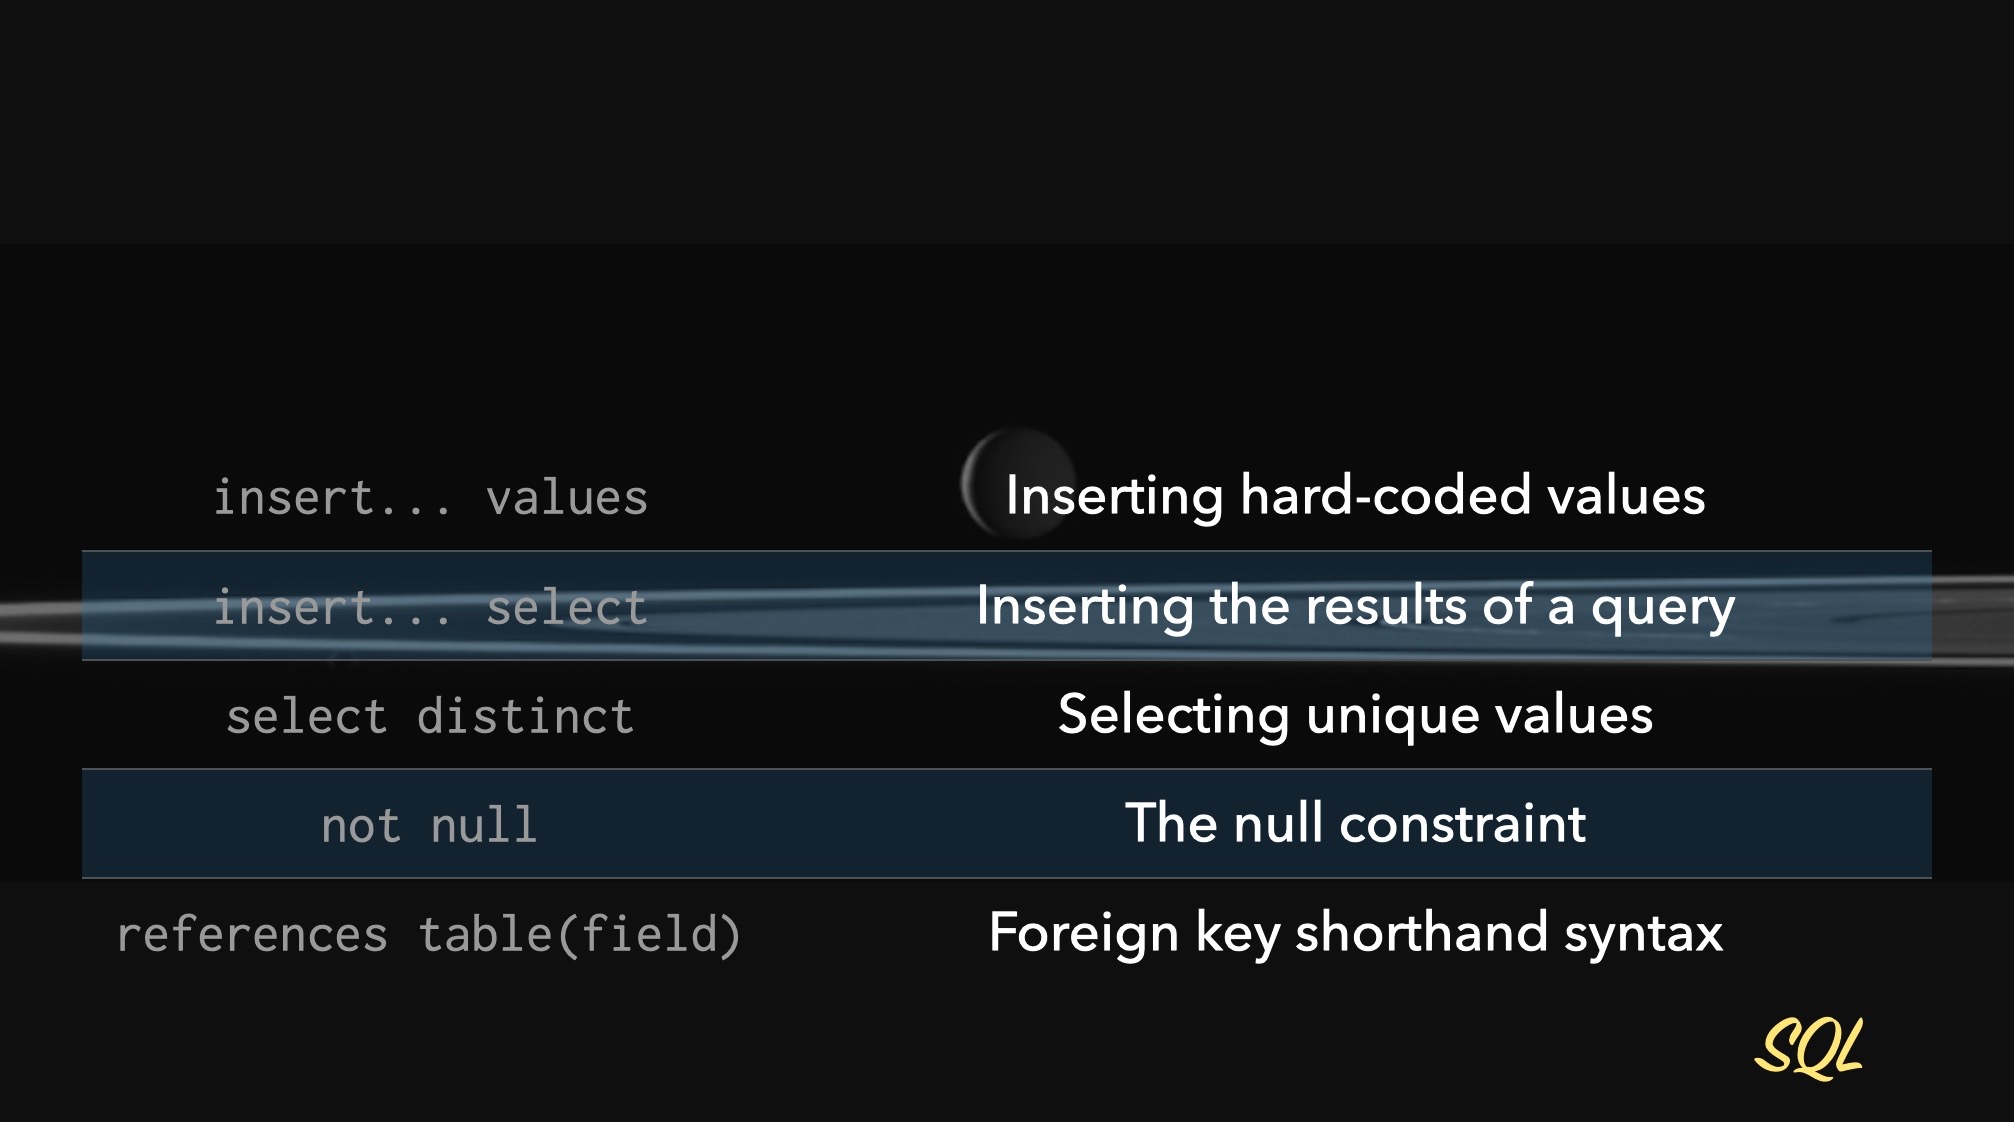
We learned a few wonderful things in this section - one of the biggest, to me, is that our job is more than running queries - it's also digging in to the data we have and ensuring that it's usable.
Into the Deep End: Digging For a Story in a Forest of Chemical Data
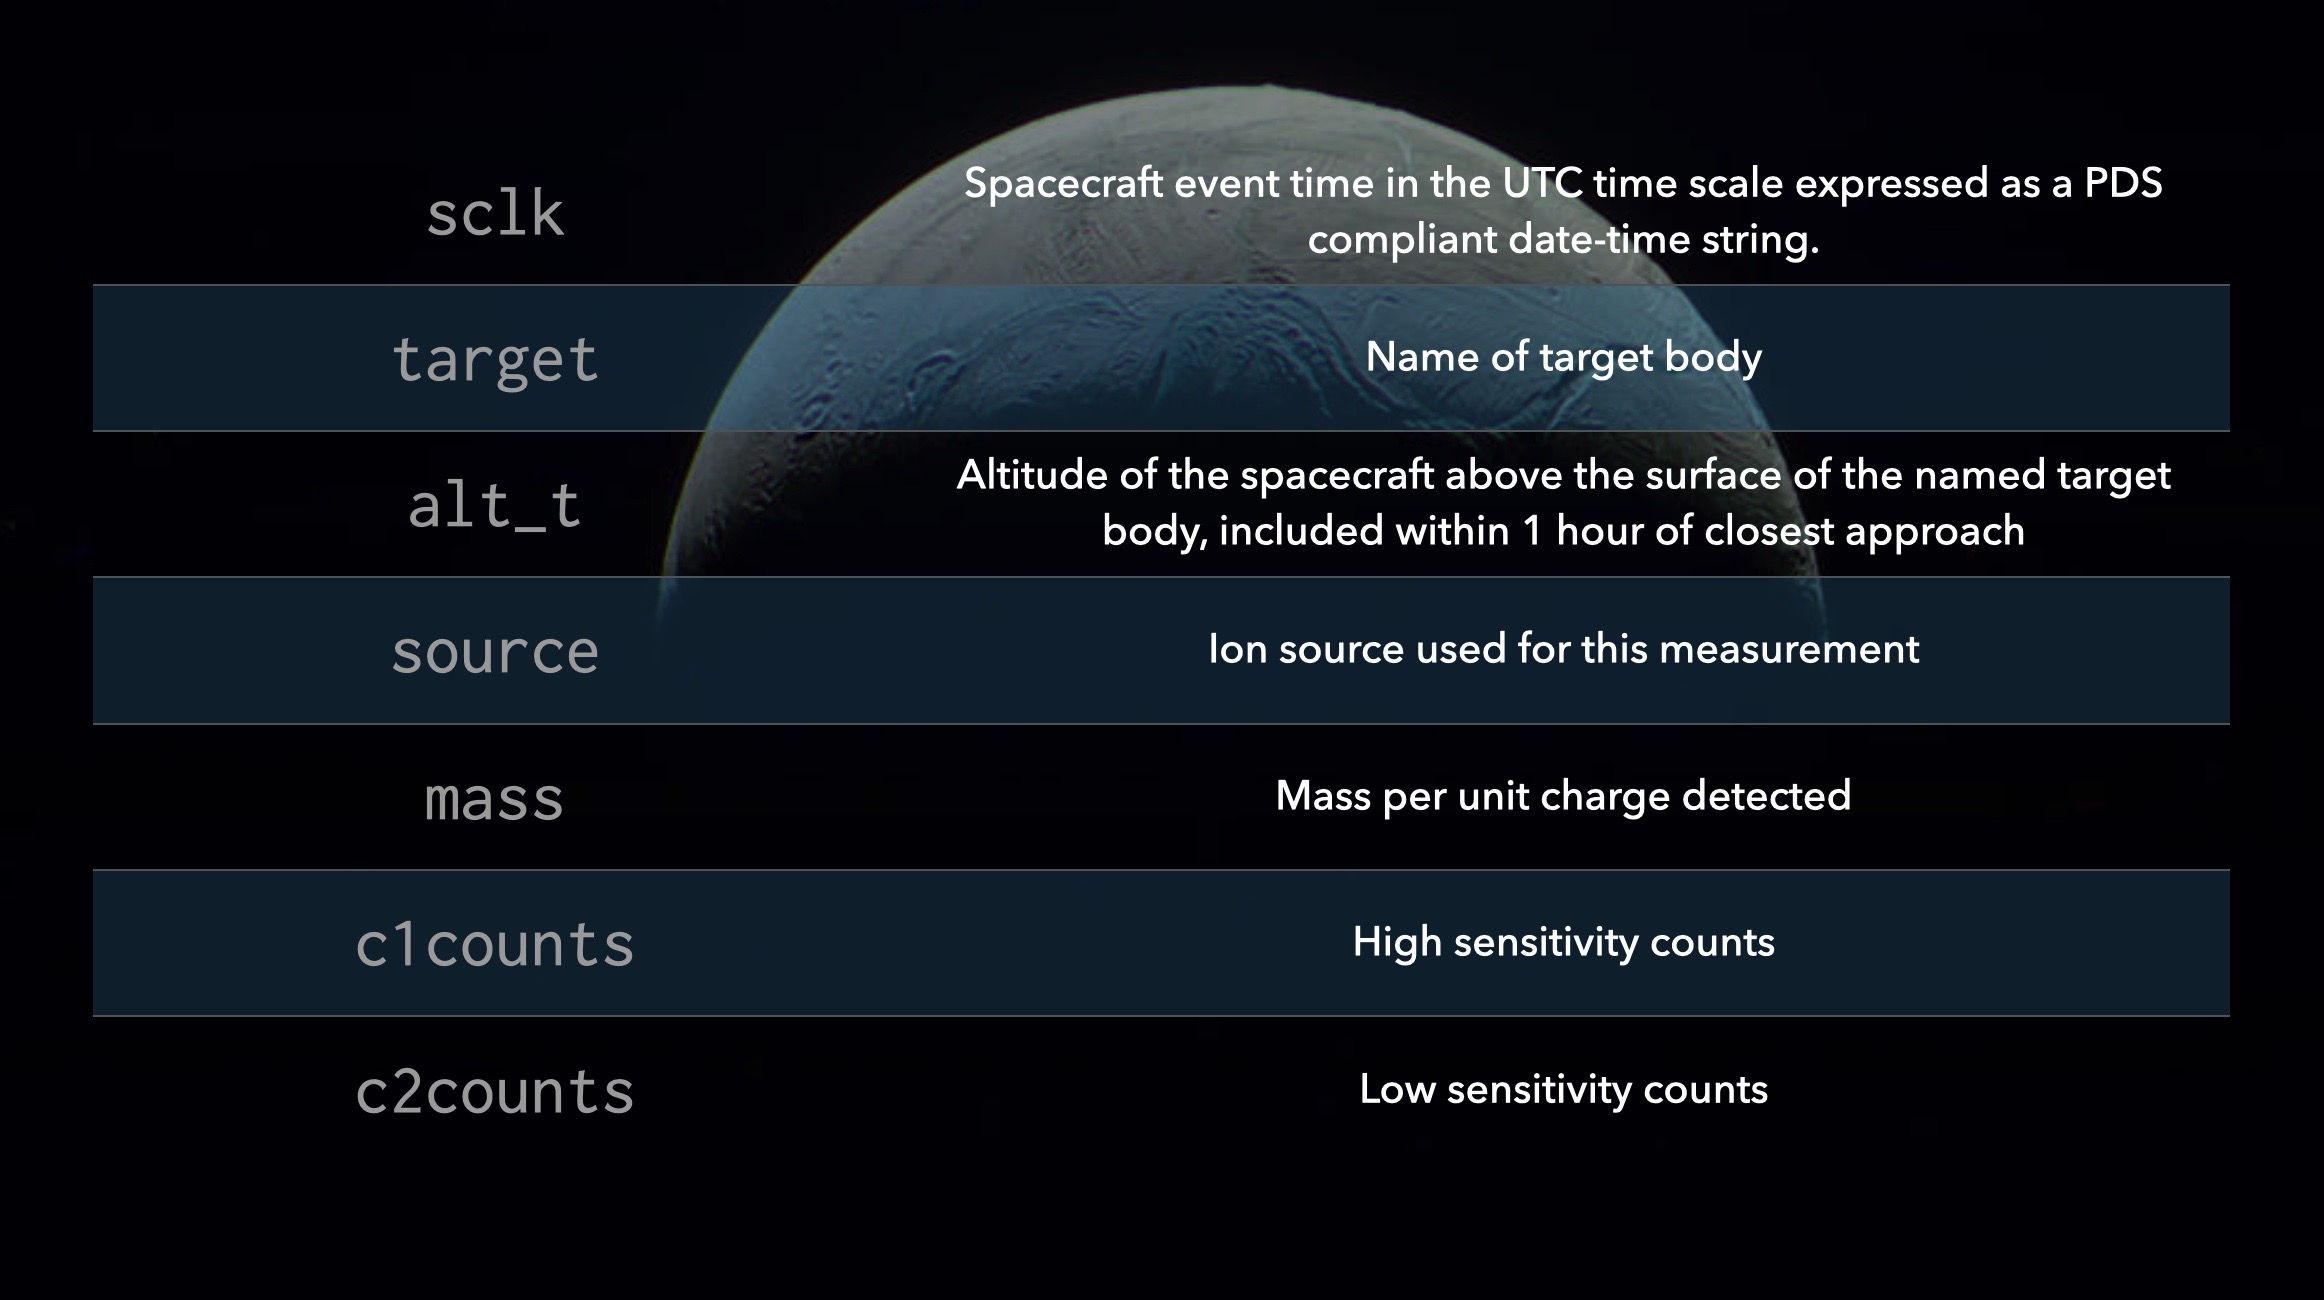
The fun begins! We have the data we need isolated and we feel good about its integrity - now we're ready to let it tell us a story. But what story is that? This is where things get interesting.
Extract & Load: Quickly Importing Raw Data into PostgreSQL
We've done this all before so let's get rolling! The first thing we're going to do is to load up the INMS and chemical data into Postgres.

CSV to SQL: How to Reliably Transform Raw Data for Analysis
The INMS CSV is loaded, now we need to create our analysis table using the full power of PostgreSQL - specifically strong data types with appropriate constraints.
Data Discipline: How Constraints Can Save Your Database (and Your Sanity)
We've been moving along at a pretty fast clip and it's crucial that we don't go too fast, skimming over super important concepts like constraints!
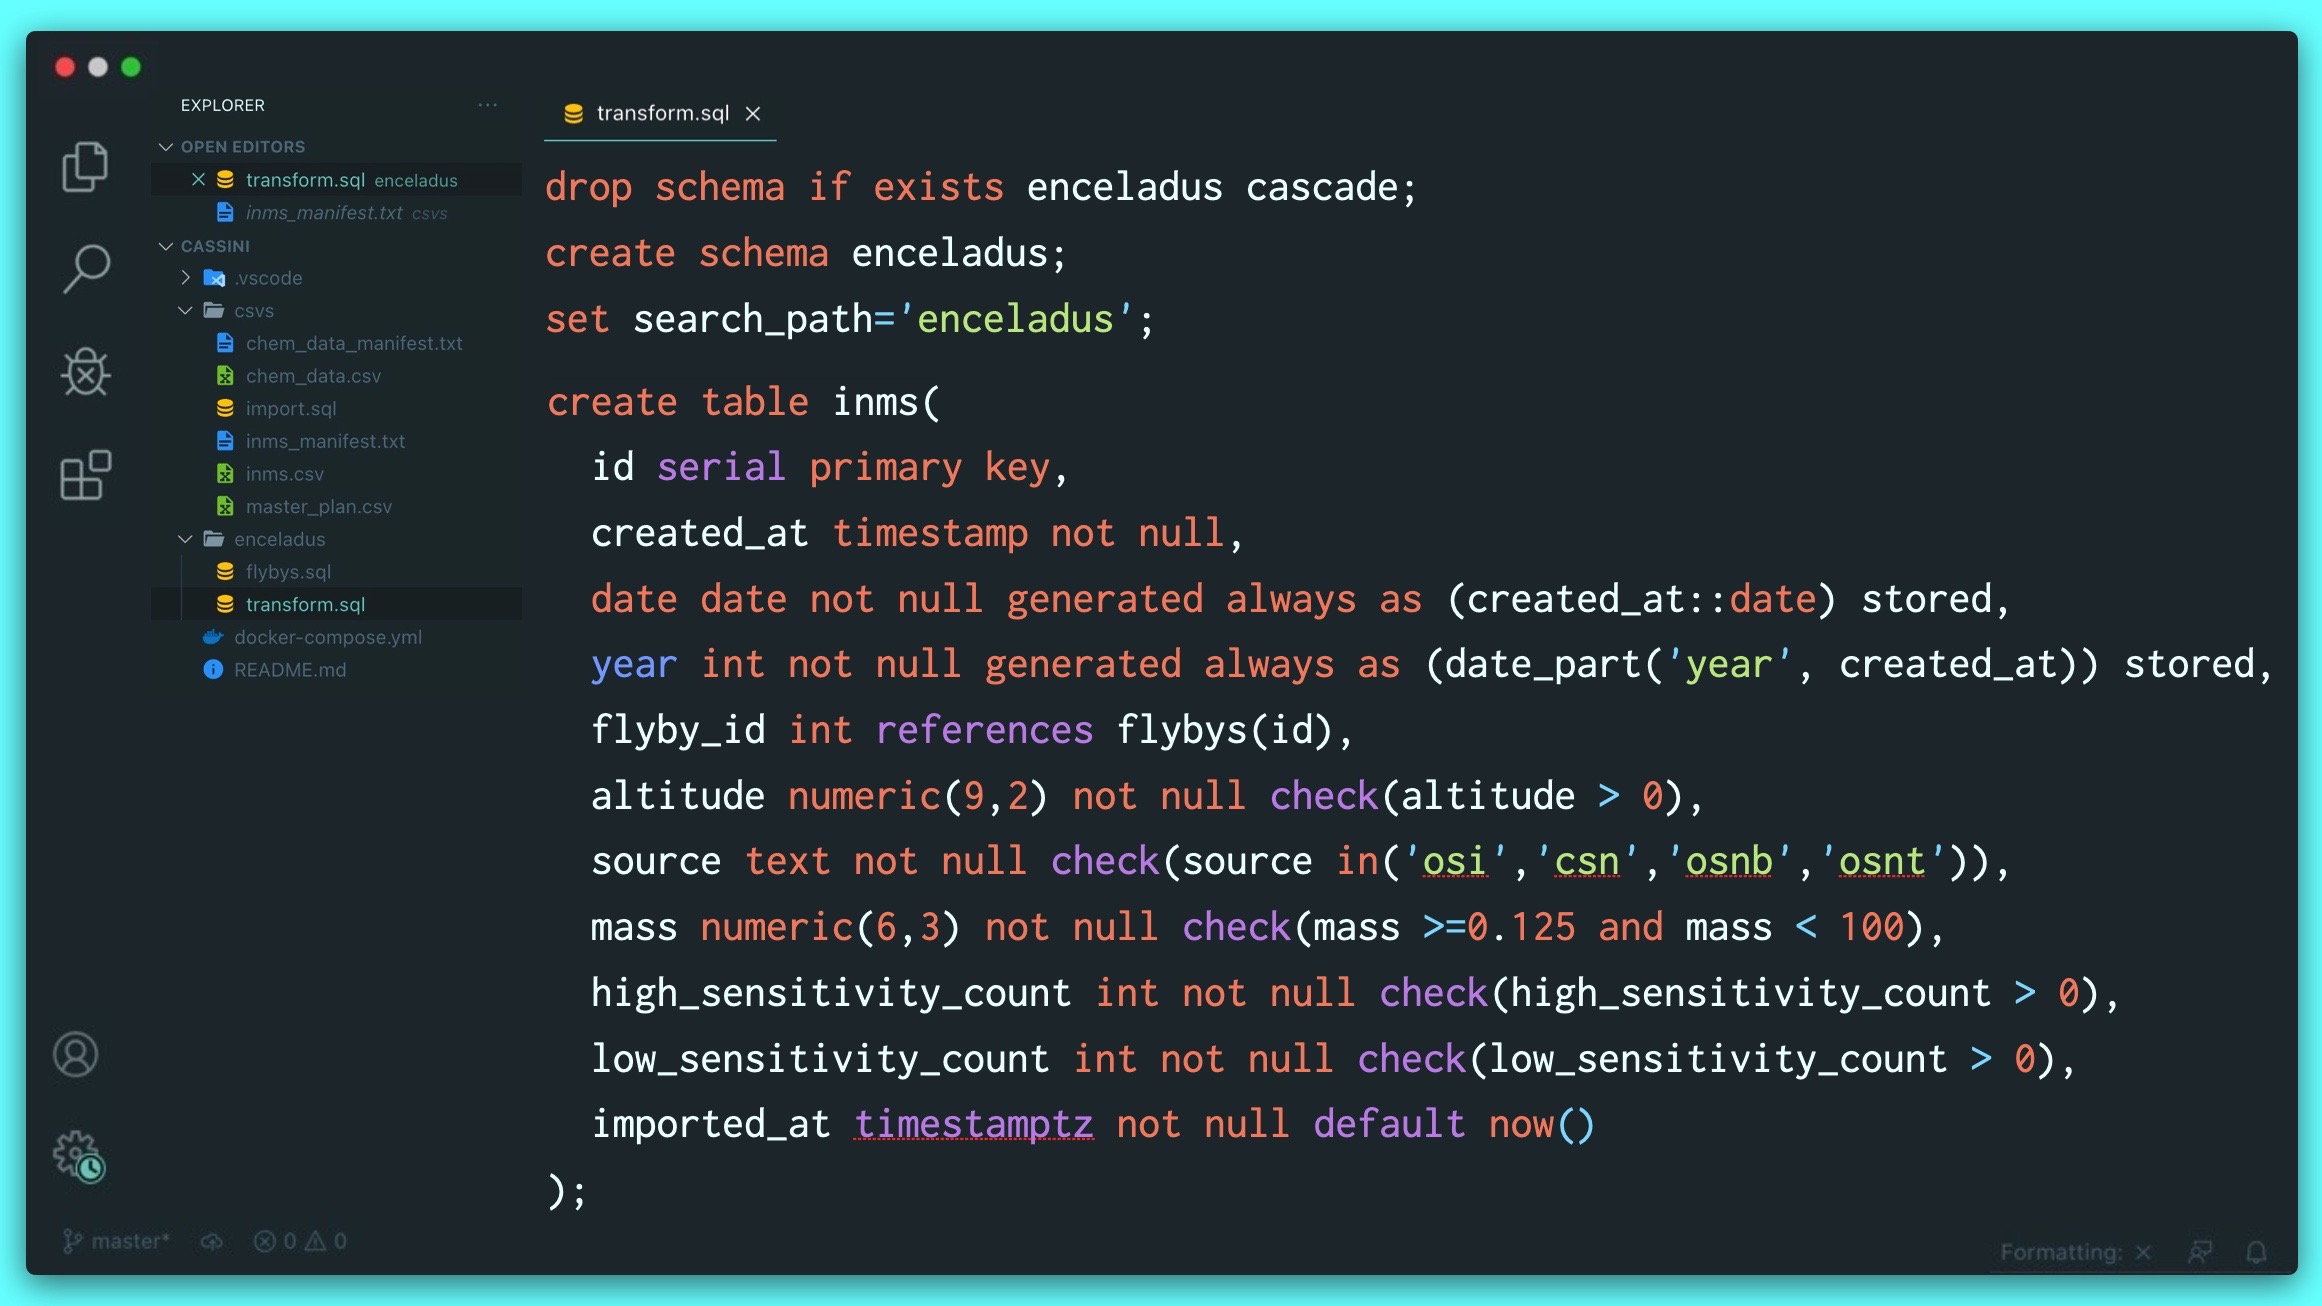
Virtual Columns and Time Travel: How to Automate Data Transformation in Postgres
Now that we understand constraints a little bit more, let's carry on and buff this table out completely. We'll add a timestamp with time zone so we know when the import happened and then we'll get into some weird stuff with generated columns!
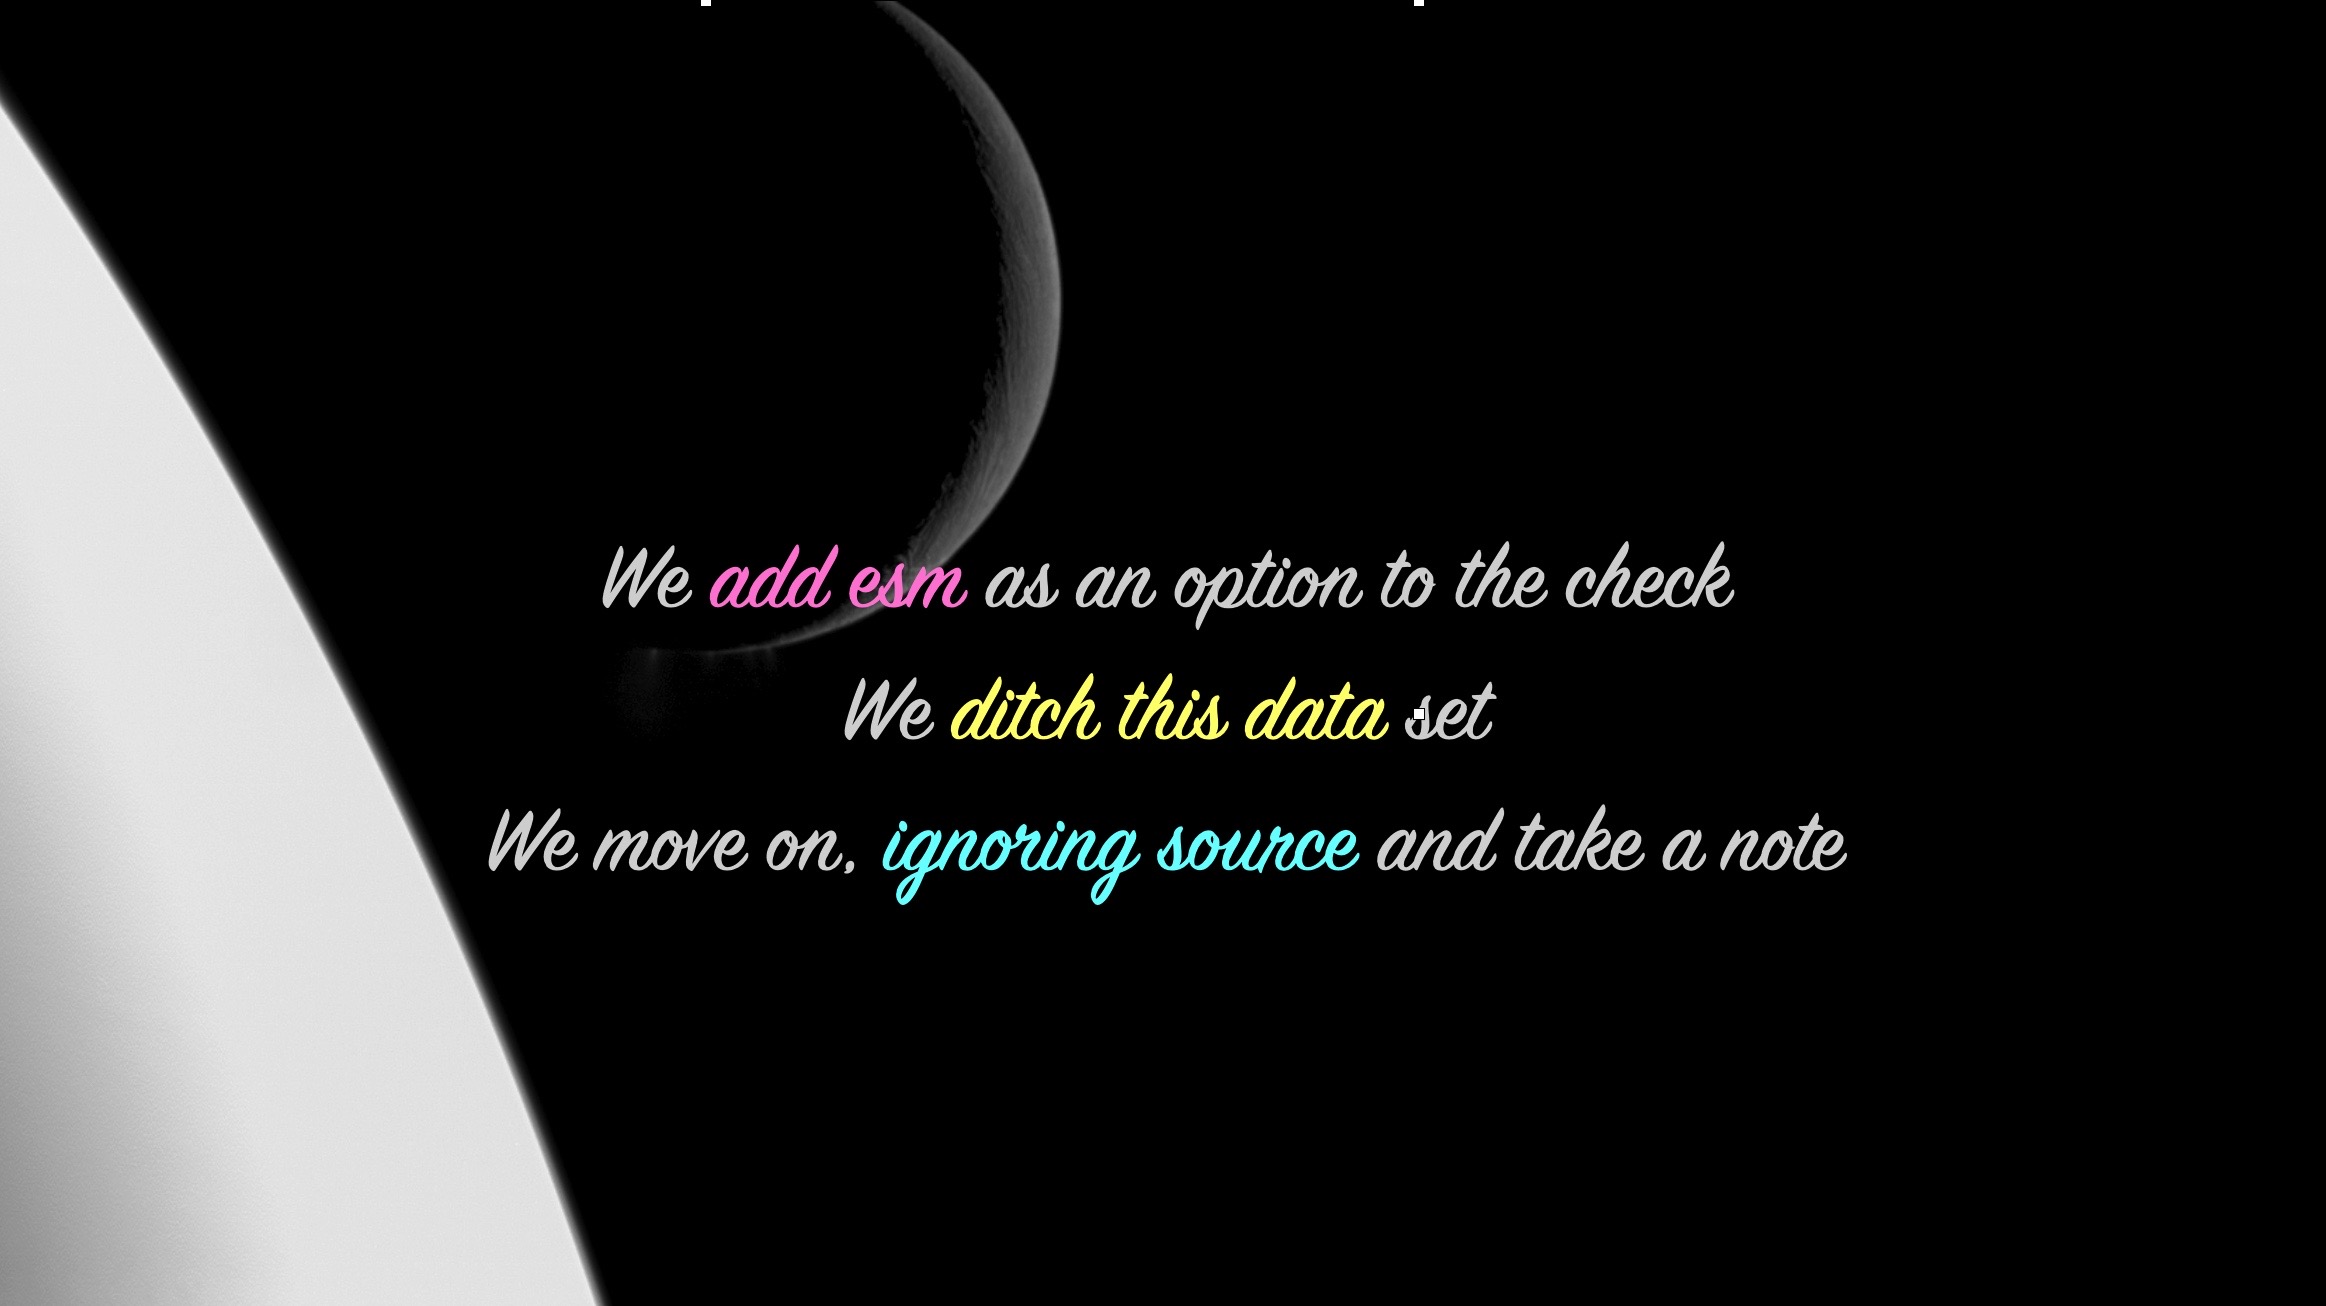
Why Your First Import Script Will Almost Always Fail
Wouldn't be any fun if we did everything right the first time, would it? Imposing rules during transformation is always problematic - which is great! We get to learn about our assumptions and also dig deeper into the data.
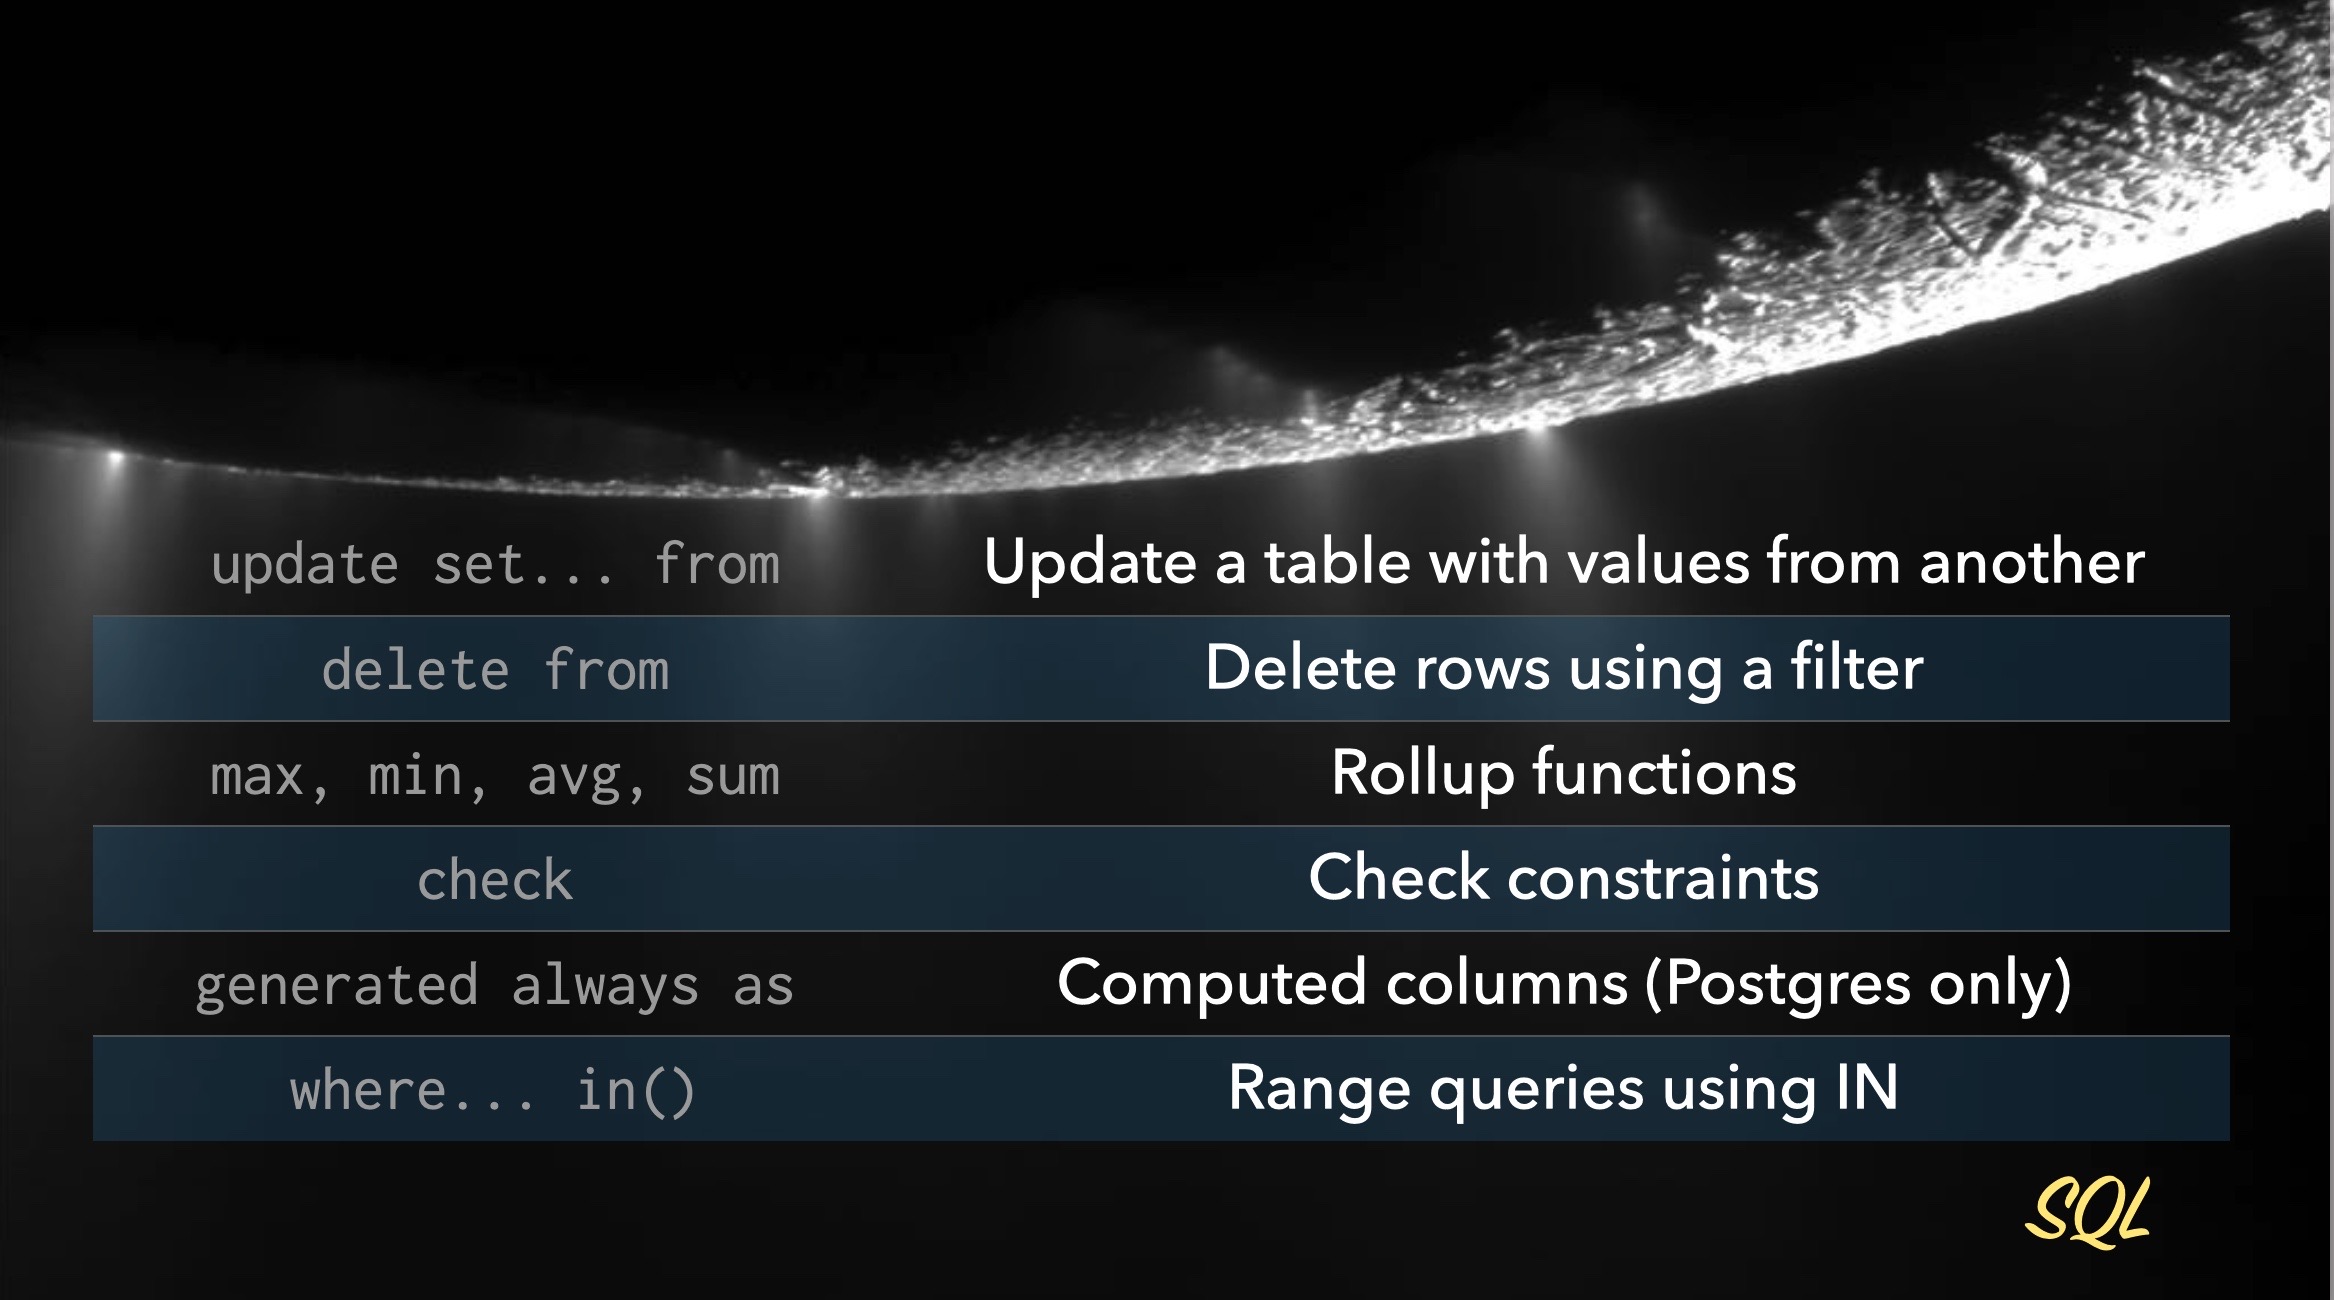
SQL Power Moves: Programming Functions to Master Your Data
That was fun work! We learned a lot of fun concepts and some new SQL!
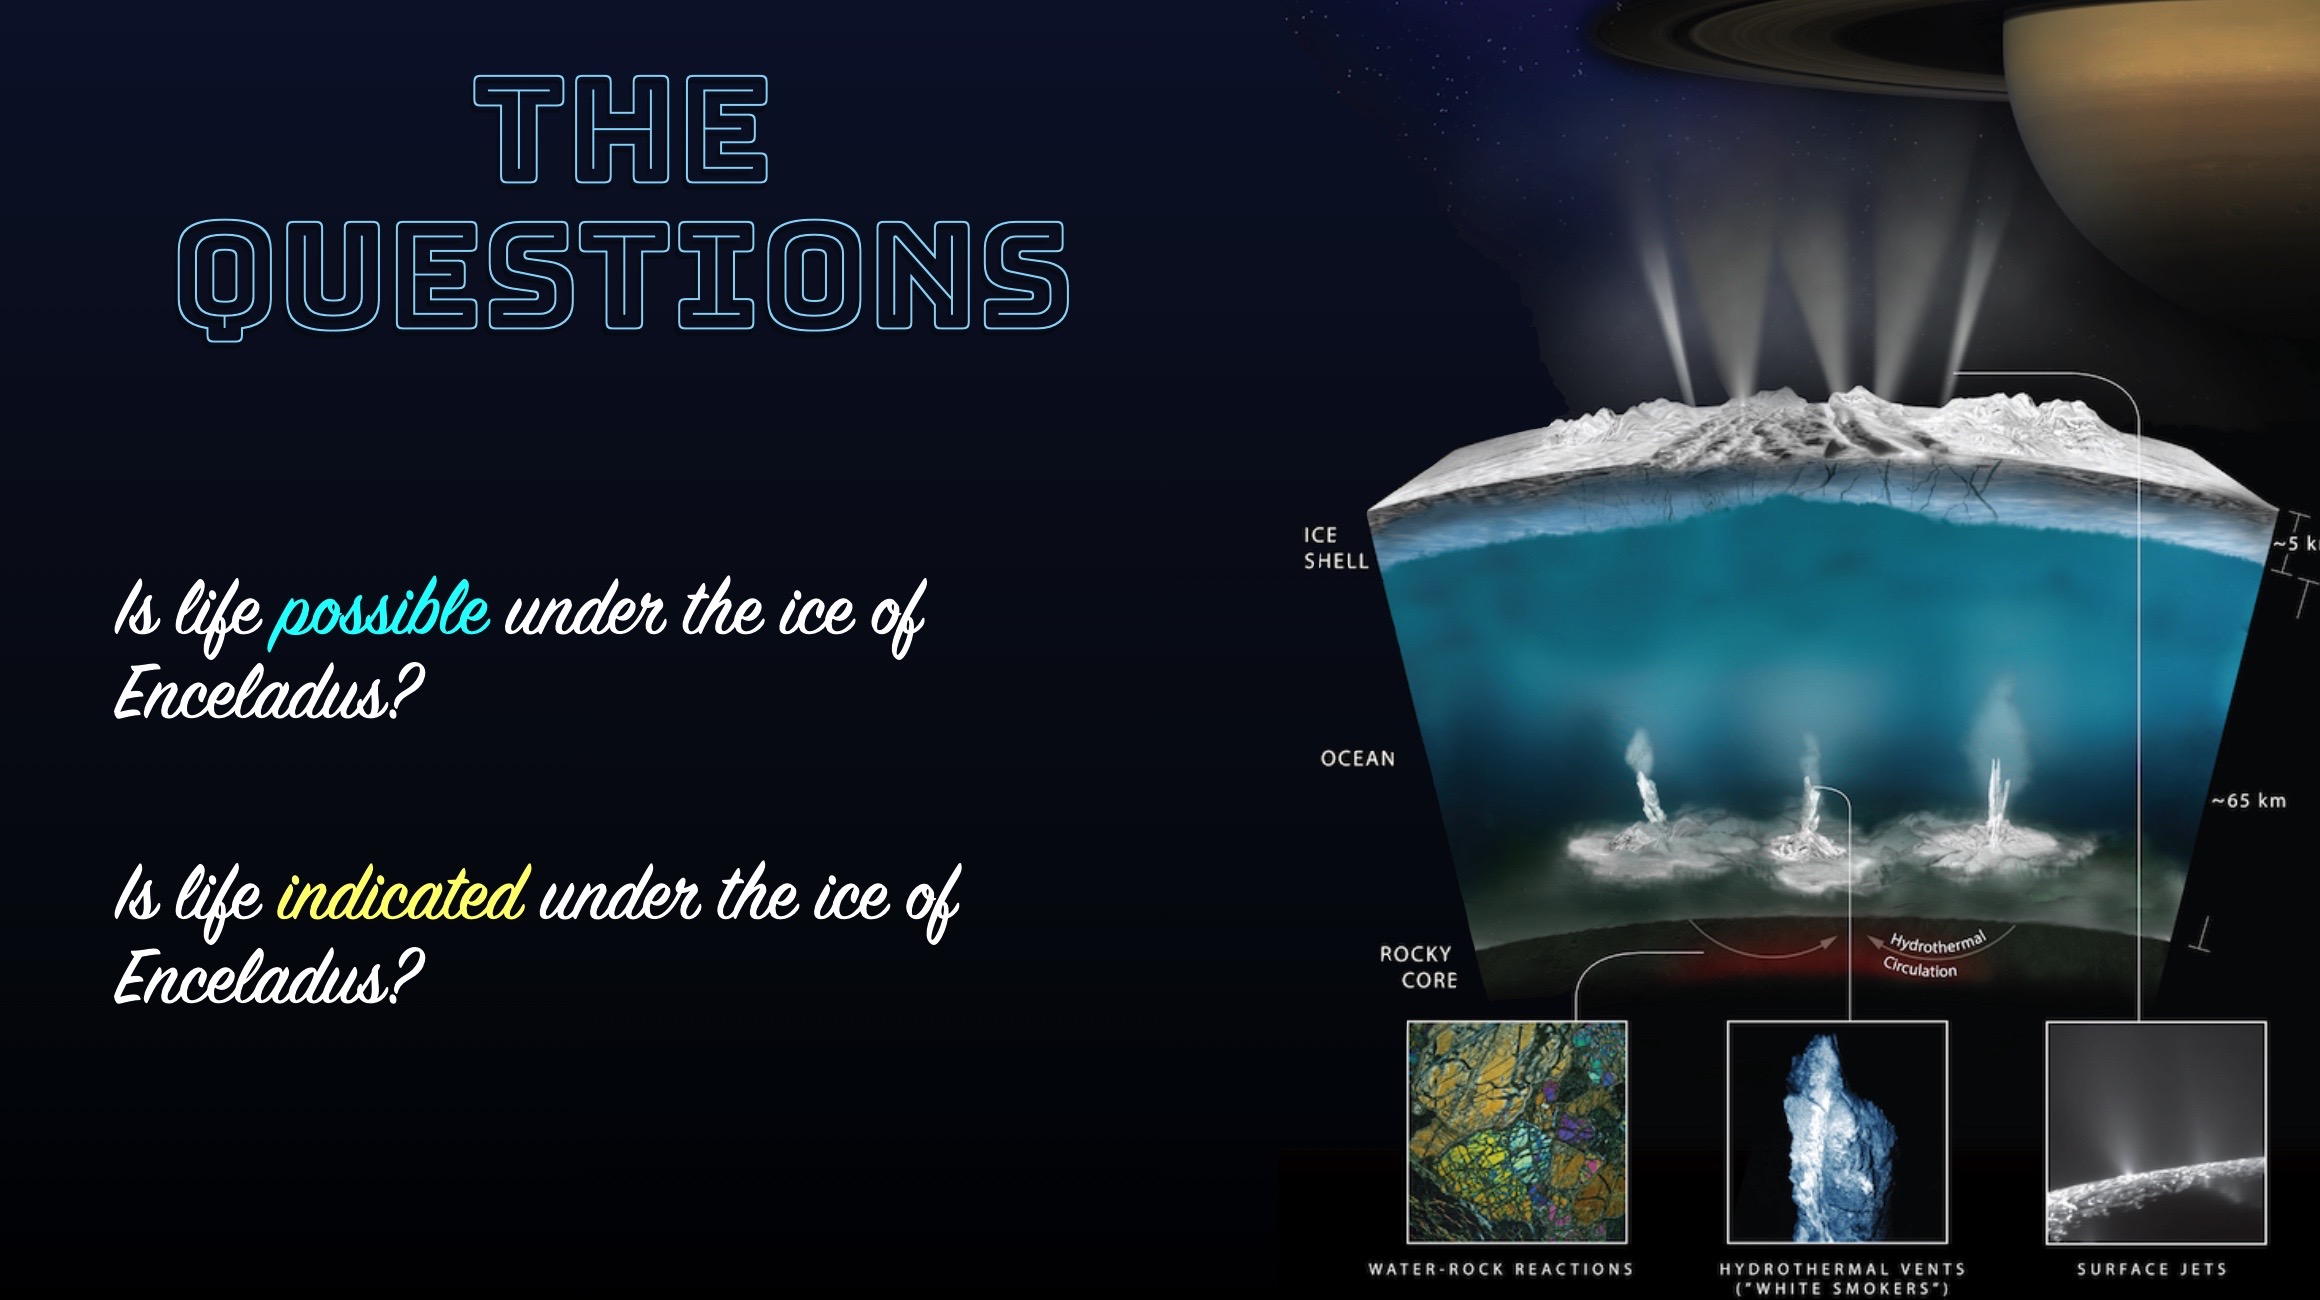
Data Storytelling: How to Let Your Data Speak (Without Your Bias)
The fun begins! We have the data we need isolated and we feel good about its integrity - now we're ready to let it tell us a story. But what story is that? This is where things get interesting.
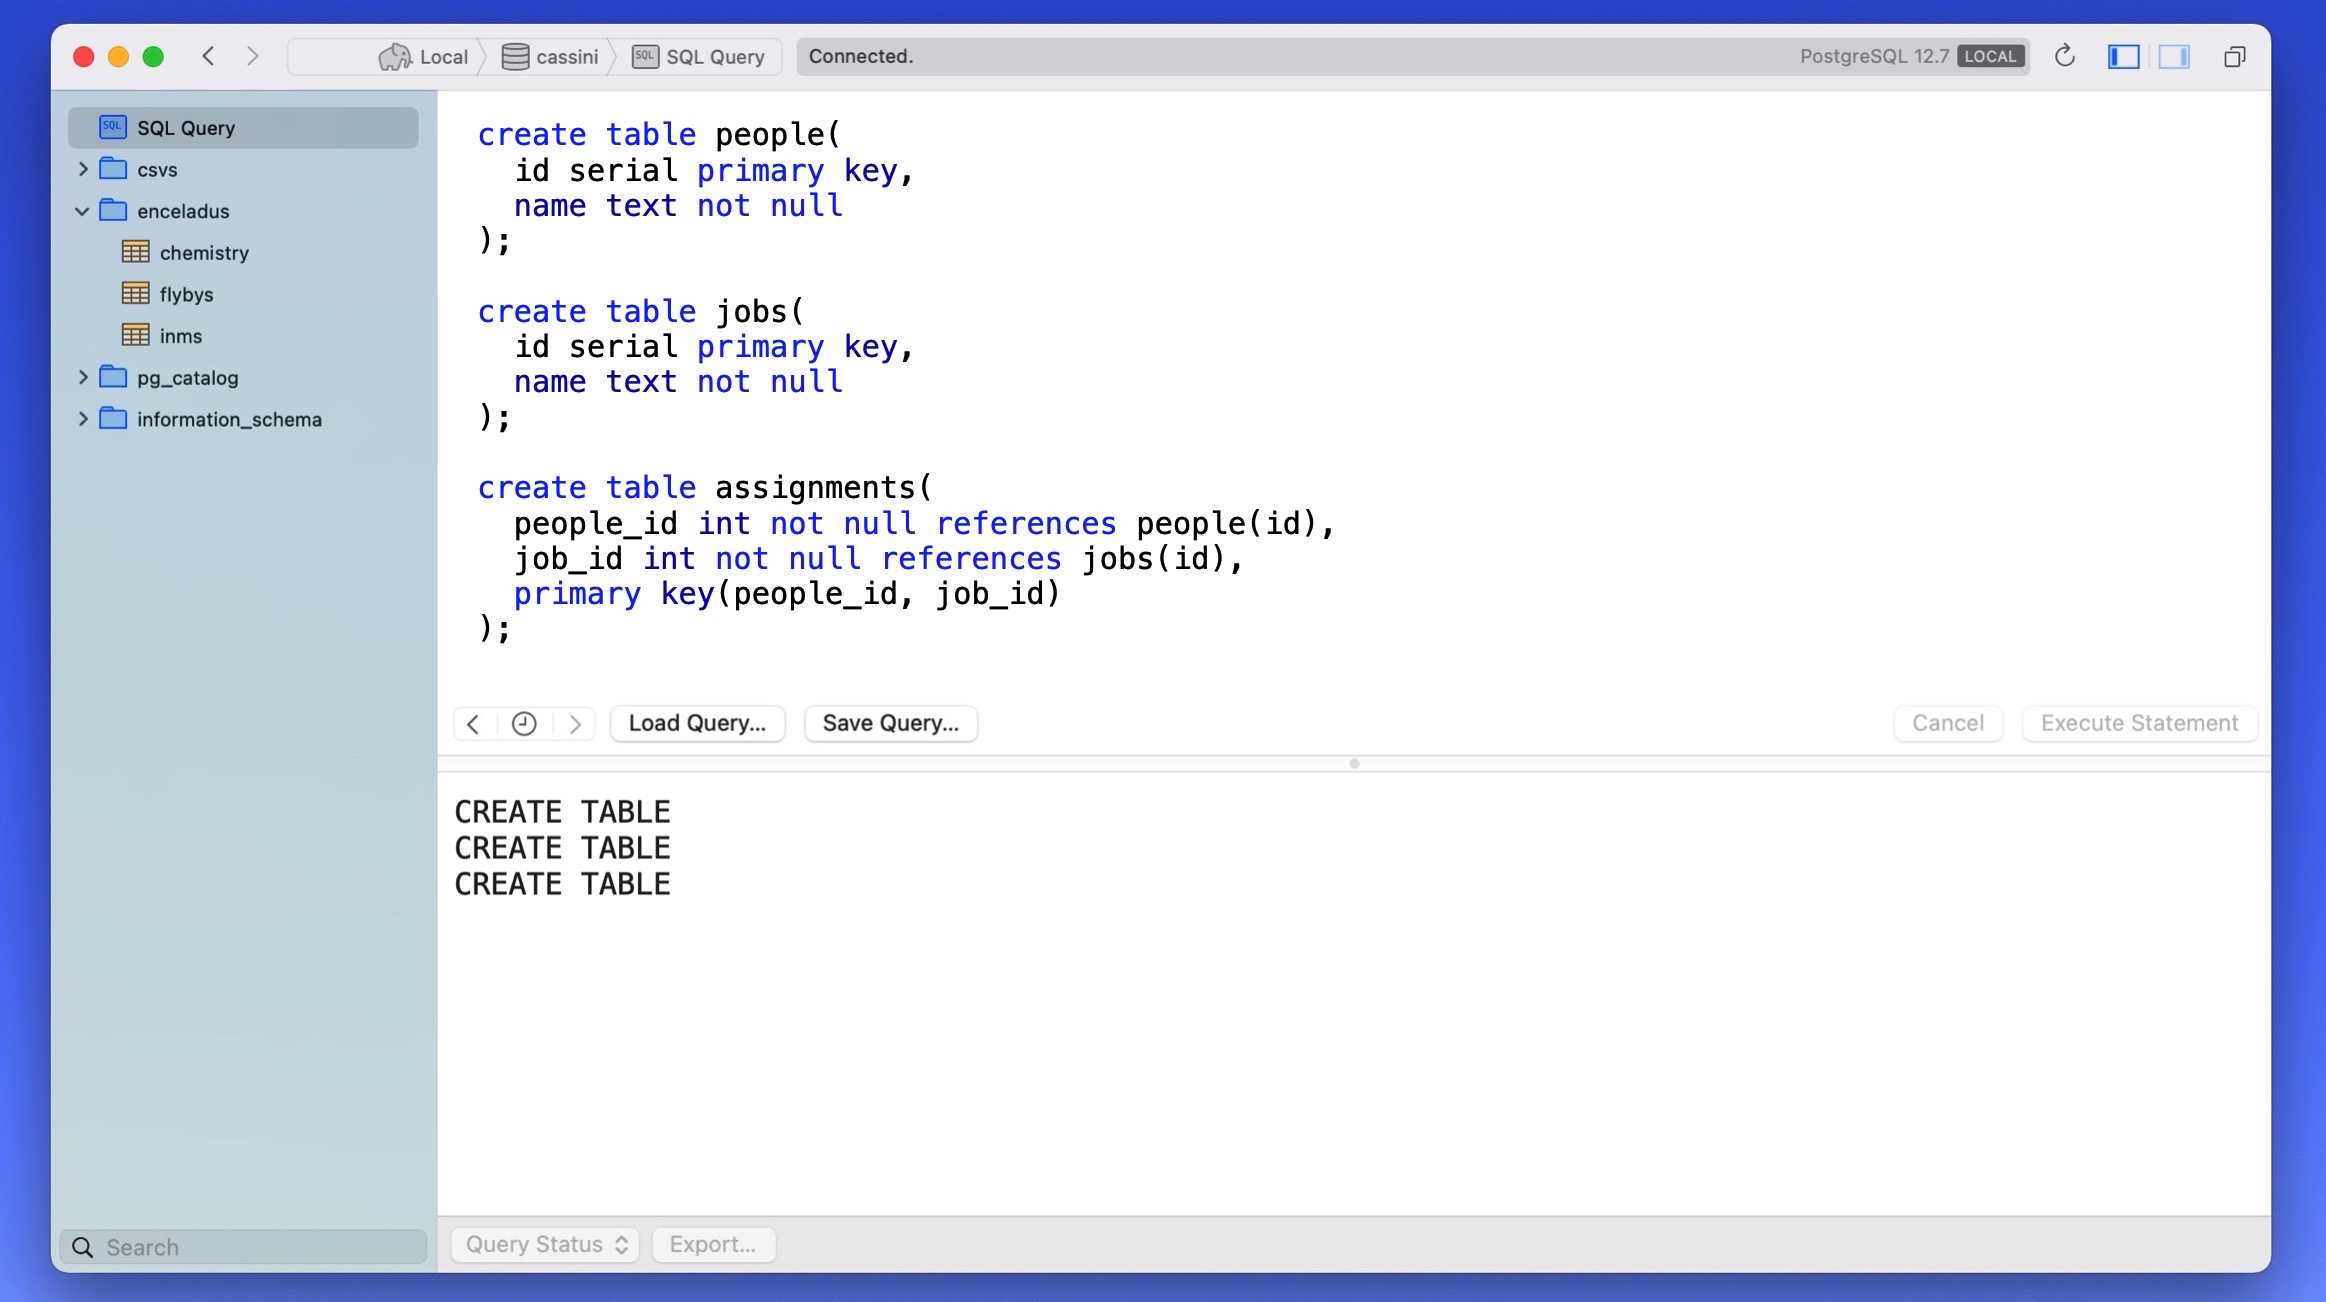
Joins & Bias: How Your SQL Queries Secretly Shape Your Data Story
Bias can creep in anywhere during the analysis process - even in the way you structure your query and the joins you use.
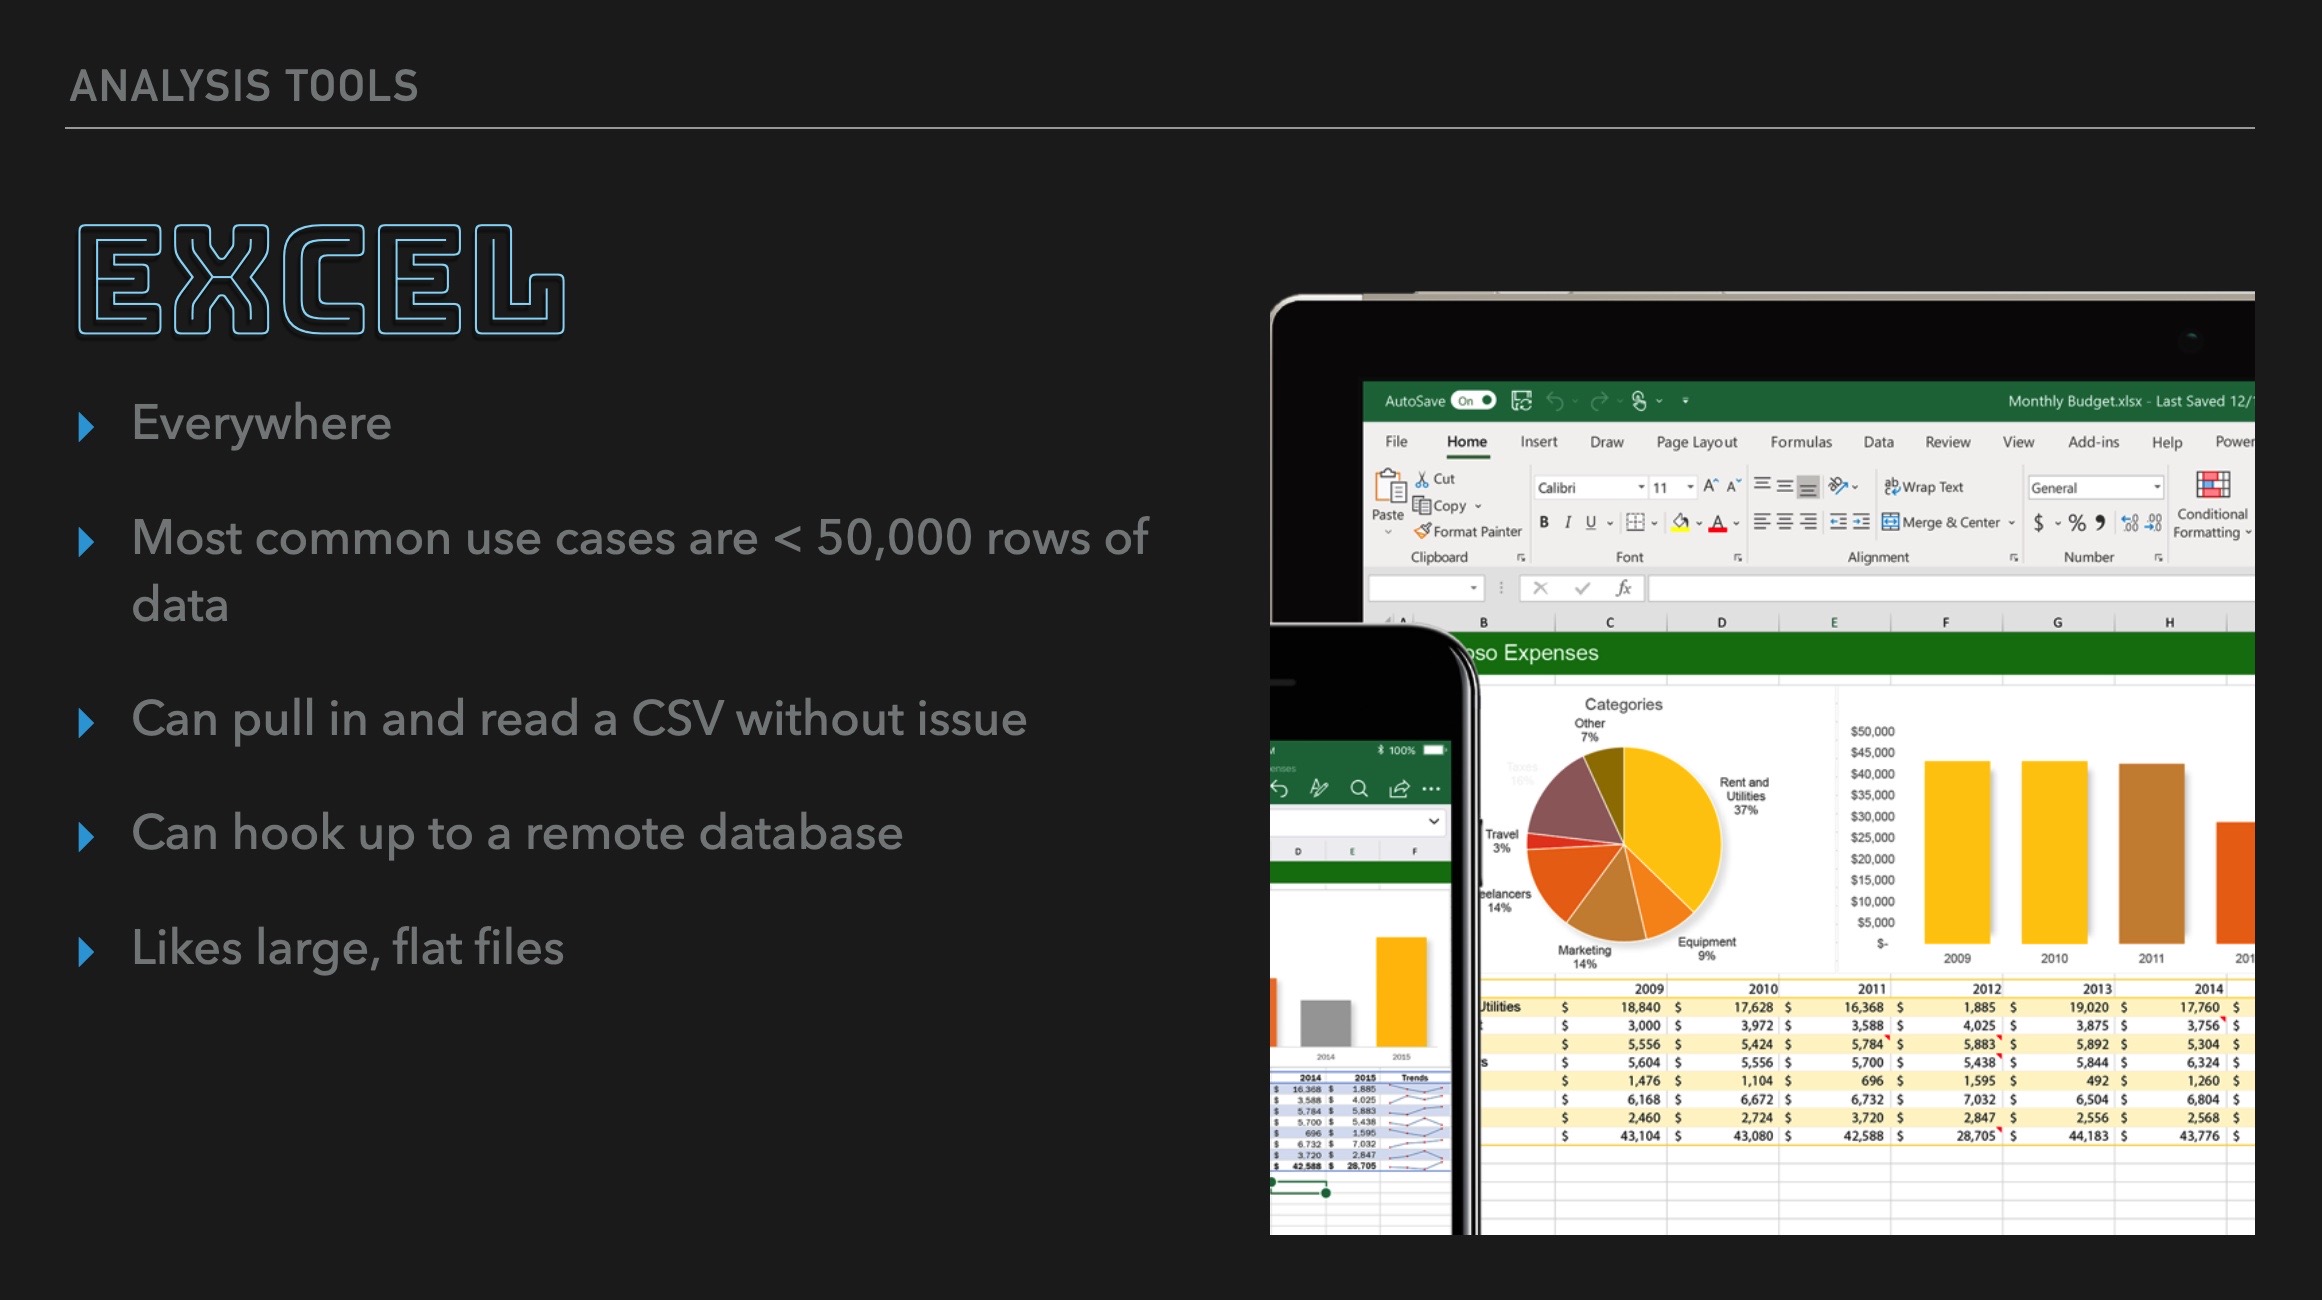
Excel Magic: How to Effortlessly Export and Visualize Your Postgres Data
Excel is EVERYWHERE and for good reason - it's simple to use, you can visualize data and you can even write simple functions and macros. Excel is the powerhouse of the analytical world and we need to prepare our data to work with it.

Should You Do It? The Ethical Questions Every Data Scientist Must Ask
It's important to take a step back from time to time and consider just what it is you're doing and why. In our case, we're working with one of the most important scientific data sets of the last century - at least with respect to planetary studies.
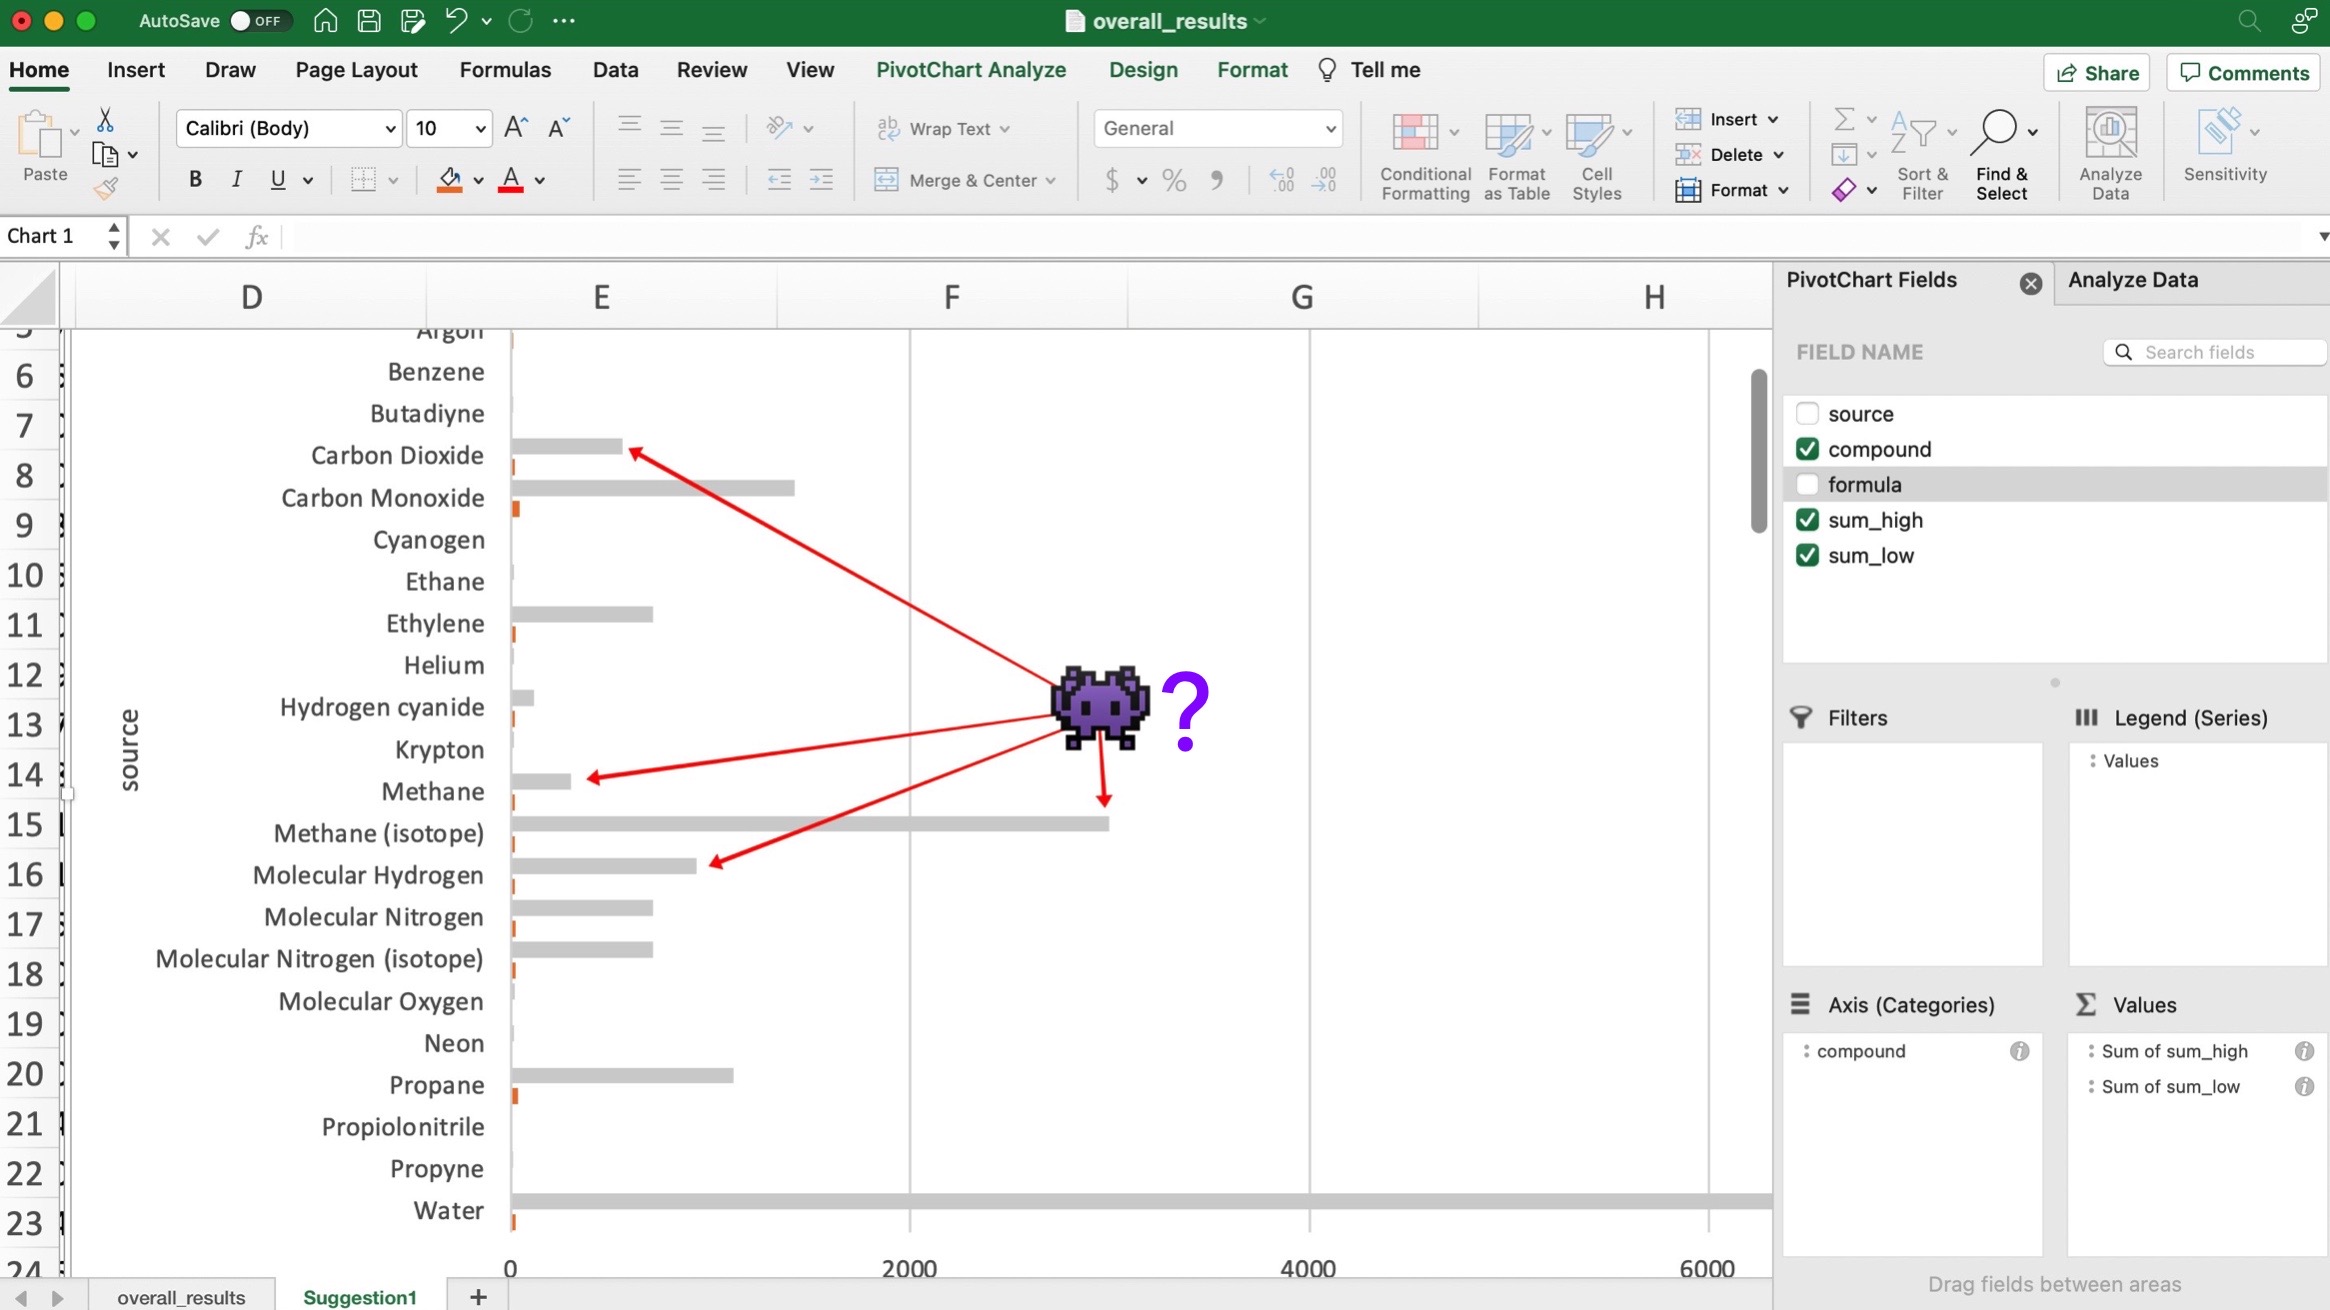
Ship It: The Fastest Way to Export SQL Data for Your Analysts
We feel good about the data and we're ready to ship it off! But how? Well that, friends, is the best part! There are multiple ways to do this but by far the simplest way is with a simple shell command using PSQL. You can drop the file anywhere you like - on your desktop so you can email it, or, what's easiest, is to use a secure file sharing system like Dropbox, Google Drive, OneDrive - whatever. Nice and fast.
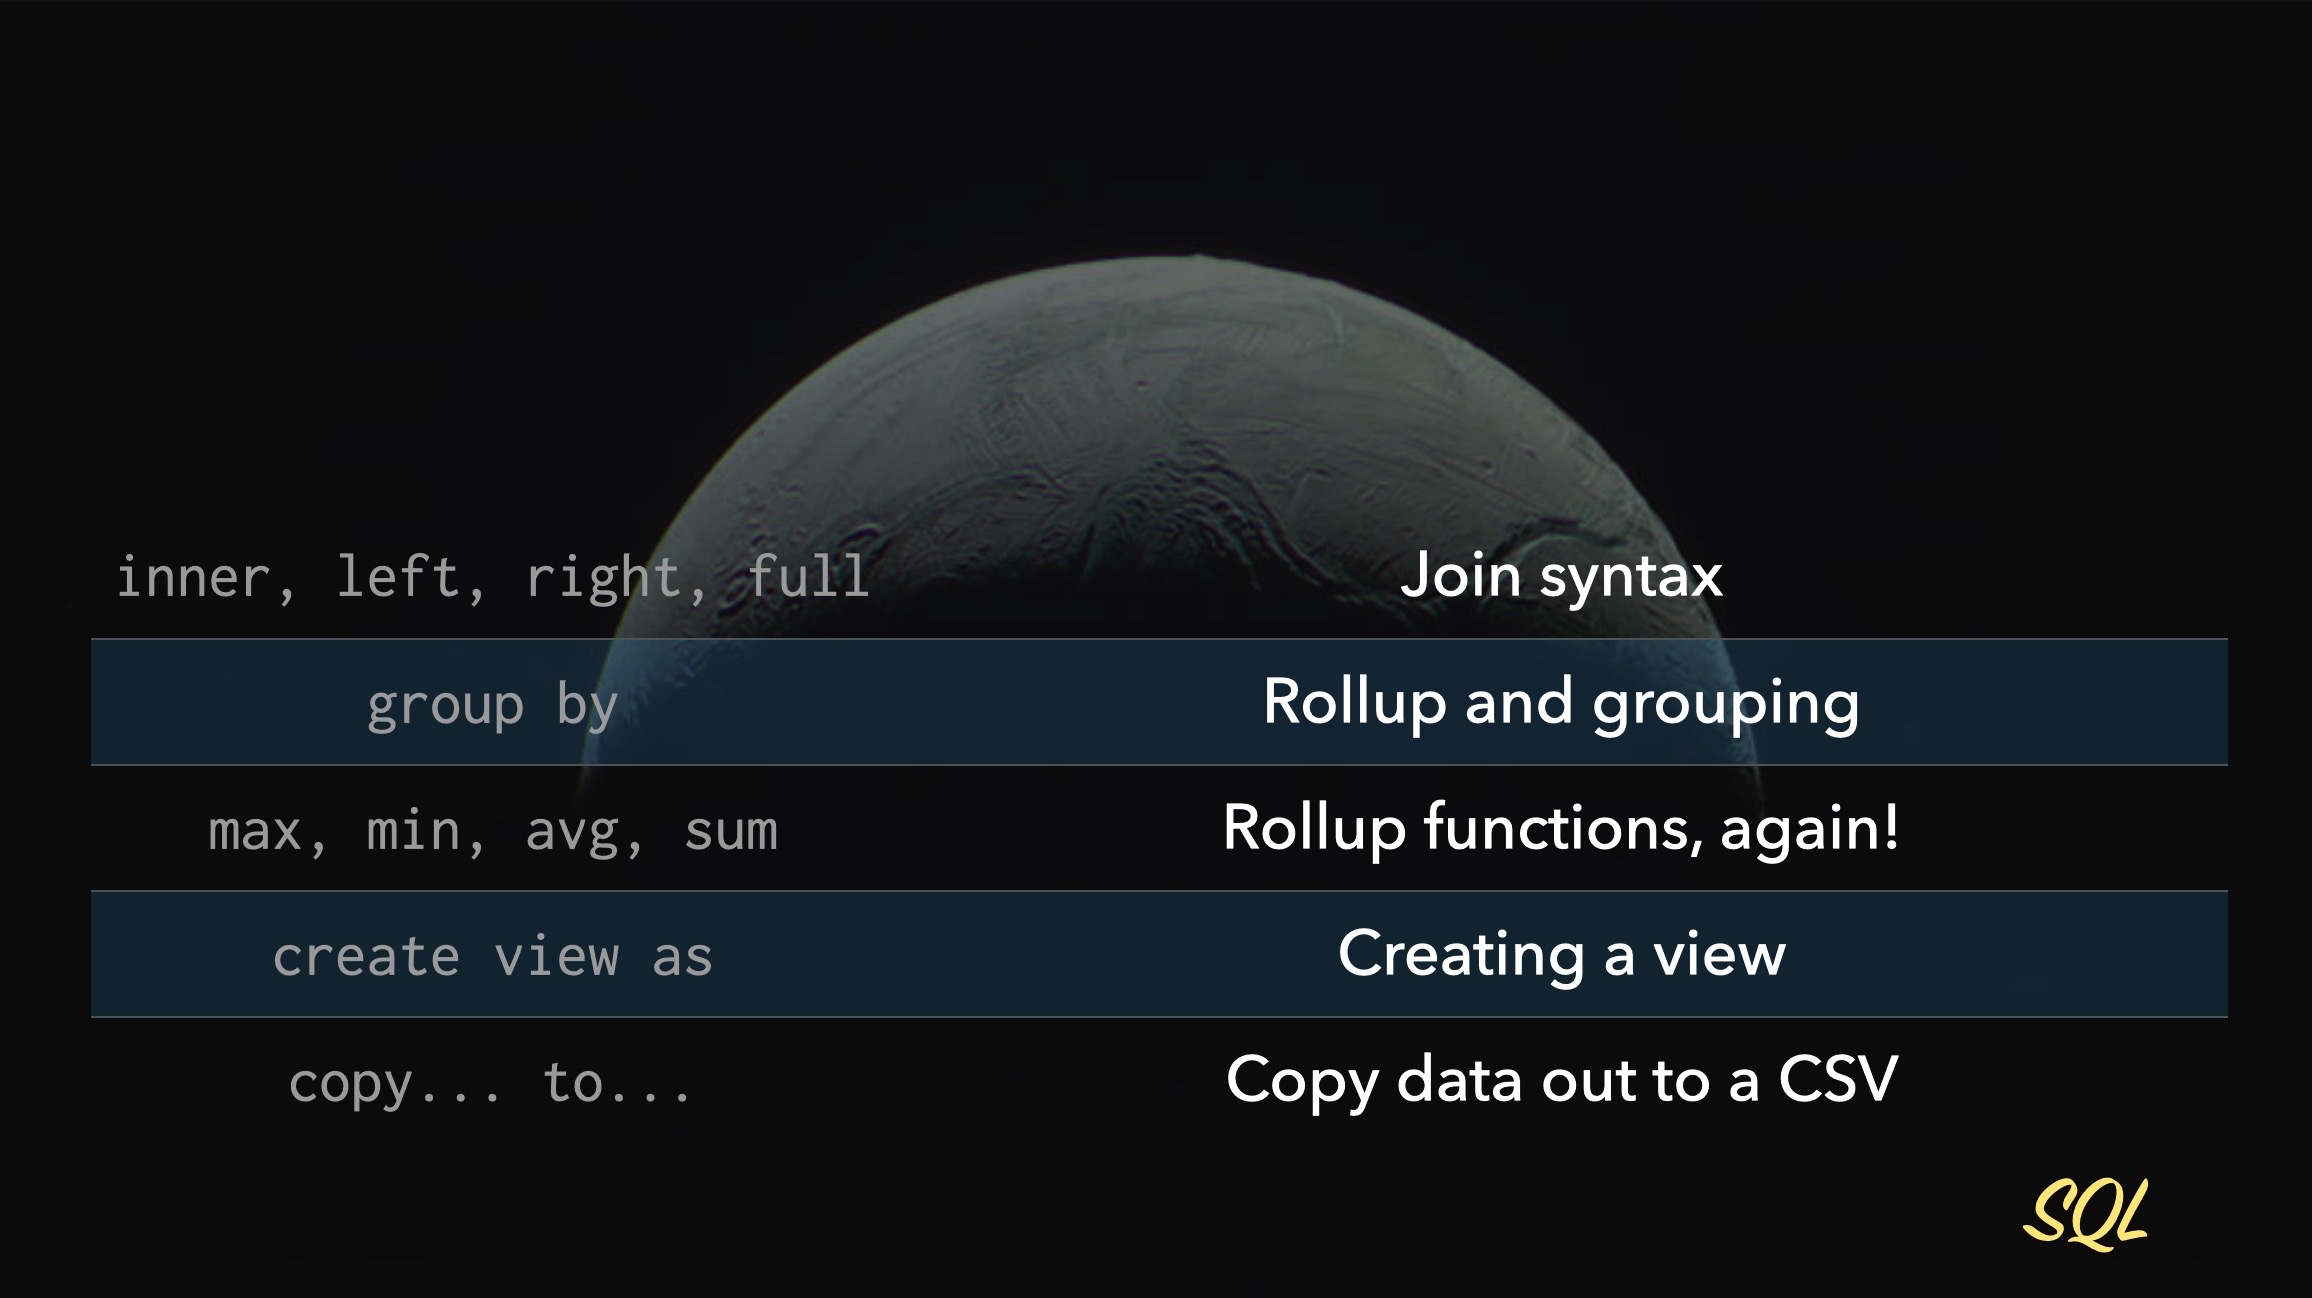
You Made It! Your Career Is About to Change Forever
Parting... is such sweet sorry! I hope you were able to follow along with me in this section - because if you did your SQL and data skills just shot up - yay for you! Thanks for watching...